
Abstract
Communication networks can reorganize before those changes become visible in message volume. This article introduces Entropy Dynamics, a prospective framework that represents rolling communication windows as reuse-based proxy graphs and monitors changes in von Neumann graph entropy under limited observability. The approach is evaluated on two 2017 Twitter corpora associated with the Internet Research Agency (IRA), for which complete source–target diffusion links are unavailable.
In the sparse October 2017 stream, the method detects concentration changes with recall of 0.958 using 9 alerts, 0.163 false alarms per day, and a median lead time of 50 hours. A Shannon-entropy baseline reaches recall of 1.000 but requires 33 alerts and provides a shorter median lead time of 12 hours. In the denser August 2017 stream, von Neumann entropy retains meaningful recall but loses most of its lead-time advantage, while simpler baselines become competitive.
The results support a bounded conclusion: entropy-based monitoring is most useful in sparse reuse streams where structural compression precedes volume escalation. The article contributes (1) a prospective entropy-monitoring protocol with no future leakage, (2) an Operating Conditions Framework that links observable stream properties to expected method strengths, and (3) a proposed two-layer monitoring architecture that combines an always-available throughput–recurrence gatekeeper with a conditional entropy monitor. The gatekeeper remains to be validated empirically.
1 Introduction
Online communication linked to coordinated or adversarial activity can change quickly in structure, attention, and participation. Researchers can often reconstruct amplification pathways, community structure, and diffusion patterns after traces have accumulated and stabilized [11, 17]. Prospective monitoring is harder. During active communication episodes, networks are incomplete, noisy, and volatile. Edges appear and disappear, actor roles shift, and measurement is shaped by missing data, deletions, platform visibility, and the absence of complete source–target diffusion links.
In settings such as platform integrity, crisis communication, and electoral information environments, timing matters [10, 18]. Methods optimized for stable snapshots are poorly suited to early intervention or prospective situational awareness. The central difficulty is uncertainty: the analyst observes partial traces of an evolving communication system and must decide whether those traces indicate emerging structural change.
This article addresses that problem as a question of structural early warning. Instead of asking whether a completed network can be explained retrospectively, we ask whether structural reorganization can be detected while it is still unfolding. The central premise is simple: uncertainty can itself be informative. When attention narrows around fewer message forms, when repeated content begins to couple otherwise separate accounts, or when a reuse pattern becomes more concentrated, the structure of the observed network may change before raw message volume does.
In hypertext terms, platform-mediated communication can be treated as a partially visible linking environment in which repeated message forms create traceable, link-like structures across accounts and time [4, 19]. Such proxy networks are analytically useful when direct source–target diffusion links are unavailable. More broadly, this framing contributes to the interpretation of large-scale linked textual environments under limited observability [1, 4, 19].
The framework introduced here, Entropy Dynamics, represents each rolling time window as a graph state and summarizes that state through von Neumann graph entropy. The method is used prospectively: every transformation, baseline, threshold, and alert at time t uses only observations available up to that time. This no-future-leakage constraint is central to the design. The goal is not to infer latent intent or to classify coordination directly, but to detect observable structural reorganization in reuse-based proxy networks.
The empirical component is a proof-of-concept study using two independently collected 2017 Twitter corpora associated with the Internet Research Agency (IRA). These corpora are useful not because they represent all influence operations, but because they provide temporally ordered, publicly studied, partially observable traces under two different operating regimes [2, 20, 26]. The October 2017 stream is sparse and reuse-oriented; the August 2017 replication stream is denser and more event-driven. Their value therefore lies both in their time ordering, which permits prospective evaluation, and in their regime contrast, which allows us to examine not only whether entropy-based monitoring can work, but also when it stops outperforming simpler baselines.
The principal contribution is not a new entropy formula, but a proof of concept showing how a well-established spectral measure can be embedded in a prospective, time-ordered monitoring workflow under limited observability. The article makes three contributions. First, it turns von Neumann graph entropy from a static graph descriptor into a prospective alerting signal for rolling reuse-based communication networks. Second, it introduces an Operating Conditions Framework that maps observable stream properties, such as density, account concentration, monitoring coverage, and signature uniformity, to expected method strengths. Third, it specifies a two-layer monitoring architecture that separates an always-available throughput–recurrence gatekeeper from a conditional entropy monitor. The first two contributions are evaluated empirically in this proof of concept. The Layer 1 gatekeeper is a proposed deployment component and remains to be validated.
The empirical claim is deliberately bounded. Entropy Dynamics provides useful early warning for concentration changes in the evaluated sparse reuse stream, but the lead-time advantage is regime-dependent rather than universal. The present prospective specification does not provide an evaluable basis for generic activity-burst milestones. These limitations are part of the contribution: they identify the operating region in which entropy-based monitoring is most informative.
1.1 Research Questions
The study addresses five questions:
RQ1. Which classes of factors can drive Entropy Dynamics in evolving communication networks under limited observability?\
RQ2. Which of these factors are measurable prospectively?\
RQ3. Can entropy-based alerts provide lead time before observable concentration-shift milestones?\
RQ4. Does von Neumann entropy add information beyond message volume and Shannon entropy over message-form distributions?\
RQ5. Under which observable stream conditions is von Neumann entropy most useful relative to simpler baselines?\
RQ3 is evaluated only for concentration shifts. No windows meet the activity-burst milestone definition under the frozen prospective specification, so the article makes no empirical claim about generic activity-burst warning.
2 Related Work
2.1 From Retrospective Network Analysis to Prospective Warning
Communication networks are often studied retrospectively. Researchers reconstruct diffusion, centrality, communities, abusive behavior, or coordinated account networks after a relevant period has already occurred [5, 11, 15, 17, 20, 22, 24, 26]. This is valuable for explanation, but less useful for early warning. In settings such as platform integrity, crisis communication, and electoral information environments, the practical question is often whether an emerging change can be detected before it becomes obvious in volume or downstream impact [10, 18].
Entropy-based methods are attractive in this setting because they summarize uncertainty, concentration, and dispersion. Following the classical information-theoretic account of uncertainty [21], Shannon entropy can track diversity in message forms or topical distributions. Von Neumann graph entropy extends the idea to network structure by summarizing the spectrum of a normalized graph operator [3, 6, 16]. The present article uses this spectral measure not as a retrospective descriptor, but as a rolling alerting signal.
2.2 Relation to FINGER and Incremental Graph Entropy
FINGER addresses the computational problem of updating von Neumann graph entropy efficiently as a graph changes [6]. The present study uses the same general entropy family but asks a different research question. It does not replicate FINGER and does not claim a new incremental eigensolver. Instead, it defines a prospective monitoring protocol under limited observability: reuse-based proxy graph construction, strict no-future-leakage calibration, alert generation, milestone-based evaluation, coverage reporting, baseline comparison, and regime-dependent interpretation. The novelty claimed here therefore lies in the monitoring and evaluation framework rather than in the underlying spectral-entropy formula. Accordingly, the study should be read as an application and extension of established graph-entropy methods to a new prospective monitoring problem, not as a replication of FINGER.
2.3 State-Based Network Monitoring
Early-warning monitoring requires a representation that can be computed on rolling time windows, remains interpretable under noisy observations, and responds to structural reorganization rather than only to changes in activity volume. The framework adopted here treats each time window as a network state and summarizes its uncertainty through a graph-entropy signal. State-based language is methodological rather than metaphysical: it provides a compact way to represent evolving network structure and compare successive windows on a common basis.
Observations arriving within a window are converted into a network representation for that window, and the resulting structure is mapped into a state-like object suitable for spectral analysis. In the proof-of-concept analysis used here, the data do not expose complete source–target retweet edges. The observable structure is therefore operationalized through account–content coupling based on repeated message forms. What matters is not simply how much activity occurs, but whether the arrangement of observable ties becomes more concentrated, more diffuse, or differently organized across windows.
2.4 Why Entropy Can Function as an Early-Warning Signal
Structural reorganization does not necessarily become visible only when volume spikes. It may begin earlier through redistribution of attention, tighter concentration around fewer actors or message forms, or shifts from dispersed to more coordinated behavior. Communication may also become mediated through a narrower set of influential or bridging actors, consistent with classical accounts of mediated information flow and recent network-centrality approaches [12, 27]. An entropy measure is attractive in this setting because it compresses such changes into a single trajectory that can be monitored over time. When the underlying network state becomes more ordered, more concentrated, or spectrally reconfigured, the entropy signal may change before simpler indicators show the consequences.
Entropy Dynamics refers here to the time evolution of that signal across successive windows. Sudden deviations, persistent drifts, or regime shifts in the entropy trajectory are treated as candidate warning signals.
3 Methods
3.1 Conceptual Driver Taxonomy
Entropy Dynamics may be shaped by five classes of drivers, summarized in Table 1. Not all are directly observable in near real time. The empirical design focuses on measurable structural and informational proxies derived from the available corpus.
Table 1: Factor taxonomy for plausible drivers of Entropy Dynamics.
Driver class | Illustrative components |
|---|---|
Structural [27] | Degree concentration, edge density, bridge activation, modularity shifts, and centralization. |
Temporal | Burstiness, synchronization, inter-event regularity, and lag compression across actors. |
Informational [14] | Content narrowing or diversification, hashtag or URL reuse, message-template repetition, attention concentration, and topical emphasis shifts. |
Measurement | Sampling windows, missingness, moderation events, API or archive constraints, and deduplication choices. |
Contextual | Breaking news, campaign deadlines, platform interventions, and offline political events. |
3.2 Data, Case Selection, and Scope of Inference
The empirical demonstration uses two independently collected IRA Twitter corpora. The main corpus is derived from Twitter's public Information Operations archive of accounts and content associated with the Internet Research Agency [8, 25]. The replication corpus is the Clemson University IRA dataset released by FiveThirtyEight [9, 13]. Together they span distinct collection methods, account sets, and activity regimes, providing a basis for regime-dependent performance characterization across two corpora.
The files available for this analysis contain tweet-level information but do not expose full retweet source–target edge lists. The empirical networks are therefore constructed from repeated message forms linking accounts to shared textual, URL, or hashtag patterns within rolling windows. This produces a reuse-based proxy network that reveals concentration and recurrence without claiming to reconstruct retweet diffusion. It preserves observable associations among accounts, repeated forms, and temporal recurrence [4, 19], which is sufficient for the present purpose.
The empirical object is not a fully observed diffusion network. The results concern changes in observable reuse patterns, not the full propagation of information across Twitter and not latent intent. All detection decisions at time t are based only on information available up to that point, preventing future leakage.
3.3 Preprocessing Pipeline and Data Flow
Table 2 summarizes the analytical workflow. The preprocessing pipeline involves five steps: text normalization, content-signature extraction, degenerate-window filtering, self-link removal, and symmetrization. Full replication details are in Appendix A.
Table 2: Analytical workflow for the prospective monitoring framework.
Stage | Operation |
|---|---|
Input stream | Tweet-level observations with account identifiers, timestamps, and observable content fields. |
Preprocessing | Text normalization, URL handling, and extraction of repeated message forms or content signatures. |
Windowing | Rolling time windows using only observations available up to time t. |
Network construction | Account–content incidence matrices and projected account–account weighted graphs per window. |
State representation | Trace-normalized Laplacian-derived operator ρt for each non-degenerate window. |
Structural signal | Von Neumann graph entropy SvN(t) and first-difference signal ΔSt. |
Alerting | Anomalous entropy changes detected via prospective thresholding from prior windows only. |
Evaluation | Alert timing compared against prospective operational milestones and baselines. |
For the main run (October 2017, 6-hour windows, 1-hour step, all posts, basic normalization), 739 windows are generated over the full month. Of these, 393 (53.2%) have $operatorname{Tr}(L_t)=0$ and are excluded from entropy alert generation. This leaves 346 evaluated windows. The median number of active accounts per evaluated window is 6, the median number of repeated message forms is 10, and the median event count is 168. The decline in event counts after approximately 20 October reflects exhaustion of the repeated-content subset under the applied filters, not a substantive collapse of campaign activity. From 23 October onward all windows are degenerate and contribute no entropy alerts.
Operationally, entropy-based monitoring is available on 346 of 739 generated windows (46.8%). The article therefore distinguishes unconditional monitoring coverage over the full stream from conditional alerting performance on informative windows. This distinction motivates the two-layer architecture in Section 3.9.
3.4 Windowing and Prospective Constraints
Let the ordered stream of observed messages be partitioned into rolling time windows Wt, indexed by t = 1, 2, …, T. Each window contains all observations whose timestamps fall within a fixed-width interval of duration Δ, with adjacent windows advanced by a step size s. If $mathcal {D}_{le t}$ denotes the subset of observations with timestamps not later than the end of Wt, then every transformation, baseline estimate, and alerting decision at time t is a function of $mathcal {D}_{le t}$ only. No normalization, threshold, or milestone label depends on future windows.
3.5 Network Construction and Empirical Operationalization
For each window Wt, a graph Gt = (Vt, Et) is constructed from account–content relations. Let xiα(t) indicate whether account i is associated with content feature α in window t. The account–content incidence matrix is
An account–account weighted projection is formed as
with diagonal entries removed. Edge weights reflect the number of shared message forms within the window. This projection is a proxy for coordinated reuse or concentration around common content forms, not direct diffusion. The weighted adjacency matrix is symmetrized if necessary.
3.6 Graph Operator, State Construction, and von Neumann Entropy
Given At, define the degree matrix Dt by
The combinatorial Laplacian is
The trace-normalized operator is
whenever $operatorname{Tr}(L_t)> 0$. This matrix is positive semidefinite with unit trace and serves as a density matrix in the graph-theoretic sense.
Let λ1(t), …, λn(t) denote the eigenvalues of ρt. The von Neumann graph entropy of window t is
Zero eigenvalues contribute zero by the continuous-extension convention 0log 0 = 0, since $lim _{xrightarrow 0^+}xlog x=0$. Higher values indicate a more distributed spectrum. Lower values indicate stronger spectral concentration. The interpretation is structural: entropy is a summary of observable organization in the windowed network.
3.7 Entropy Dynamics, Alerts, and Milestone Evaluation
Entropy Dynamics is operationalized through first differences,
Let $mu _t^{(Delta)}$ and $sigma _t^{(Delta)}$ denote the expanding baseline mean and standard deviation estimated from past ΔS values only. The standardized anomaly score is
for windows where $sigma _t^{(Delta)}> 0$. An alert is generated when
The threshold is a fixed design choice and is not optimized on future outcomes.
Operational milestones are defined directly from window-level statistics as evaluation targets, not as ground truth for latent intent: (1) activity burst, where total message count exceeds a high historical percentile, and (2) concentration shift, where Herfindahl concentration of repeated message forms exceeds the expanding 95th percentile. Under the frozen prospective specification used here, the activity-burst family produces no evaluable milestones. The empirical claims in this article therefore concern concentration shifts.
Detection is evaluated with a fixed look-back horizon of L = 72 hours. This horizon was selected before comparing methods, based on the temporal spacing of concentration-shift milestones and the cross-correlation diagnostics reported in Appendix C. It was not tuned to maximize recall. Because horizon choice can materially affect early-warning metrics, all reported results should be read as conditional on L = 72 hours. No claim is made that 72 hours is an optimal horizon. The reported metrics are therefore conditional on this fixed design choice, and they should not be interpreted as robust to alternative look-back horizons.
Performance is summarized using recall, false alarms per day, and median lead time. Recall is the share of milestone windows that receive at least one qualifying alert within the look-back horizon. False alarms per day are alerts not credited to any milestone divided by the monitored time span in days. Median lead time is computed from the most recent qualifying prior alert for each detected milestone. Because L = 72 hours, a single alert can qualify as a precursor to any milestone that falls within the subsequent 72-hour interval. A method with fewer alerts can therefore still achieve high recall if those alerts are well placed, while a method with many alerts may achieve perfect recall at the cost of higher false alarms and shorter effective lead time. The comparison between von Neumann entropy and the Shannon baseline in Table 4 should be read with this crediting structure in mind.
Coverage is reported as
Coverage separates two distinct questions: how well the method performs on informative windows, and how often the stream contains enough relational structure for the method to be deployed at all. Section 3.9 addresses coverage directly through the two-layer architecture.
3.8 Baselines and Comparative Evaluation
Two baseline signals are used for comparison. The volume baseline monitors total messages per window:
The Shannon-entropy baseline monitors content diversity:
Each baseline is converted into alerts under the same prospective thresholding logic.
3.9 Two-Layer Monitoring Architecture
The entropy-based alerting framework is defined only for non-degenerate windows in which $operatorname{Tr}(L_t)> 0$. In the main corpus, 393 of 739 windows (53.2%) are degenerate, creating a structural coverage gap. To address this gap without changing the reported entropy alert statistics, we specify a two-layer monitoring architecture that separates an always-on gatekeeping layer from the conditional entropy layer.
Layer 1: Throughput–Recurrence Gatekeeper. The gatekeeper operates on two window-level statistics: message throughput Vt and the recurrence rate
A deployment could flag a window as structurally informative when either Vt or Rt exceeds a low prospective threshold, such as τ1 = 1.5 standard deviations above its expanding baseline mean. Layer 1 is always available because it requires only counts and repetition statistics. It is not empirically validated as a detector in the present study.
Layer 2: Conditional Entropy Monitor. Layer 2 is active only when the window is structurally informative and $operatorname{Tr}(L_t)> 0$. It applies the entropy anomaly score $Z_t^{(Delta)}$ with threshold τ2 = 2.5 as defined above. The alert statistics reported in Tables 4 and 5 are unchanged: Layer 2 performance is identical to the single-layer entropy specification because the entropy computation itself is unaffected.
Fallback. For windows in which Layer 2 is unavailable, an always-available marginal monitor, such as volume or Shannon entropy over repeated forms when available, can serve as a fallback signal. This fallback is a deployment design rather than an additional evaluated detector in the present article.
Table 3 summarizes the architecture. Under this design, monitoring coverage can be continuous at the system level, while Layer 2 entropy coverage remains 46.8% in the main corpus and 56.4% in the replication corpus. The coverage metric in Equation 10 should therefore be understood as Layer 2 conditional coverage, not total system coverage. Empirical validation of the gatekeeper and fallback layers remains future work.
Table 3: Two-layer monitoring architecture. Thresholds are prospective design choices; only Layer 2 entropy performance is evaluated.
Layer | Signal and trigger | Role |
|---|---|---|
Layer 1: gatekeeper | Throughput Vt and recurrence rate Rt; low prospective threshold. | Always-available screening. |
Layer 2: entropy | SvN(t) and $Z_t^{(Delta)}$; active when $operatorname{Tr}(L_t)> 0$ and τ2 = 2.5. | Structural warning. |
Fallback | Volume or Shannon signal when Layer 2 is unavailable. | Coverage support. |
3.10 Uncertainty, Validation Scope, and What Is Not Estimated Here
The article evaluates operational usefulness rather than estimating a causal effect of entropy on communication outcomes. The reported metrics are descriptive monitoring summaries, not precise population estimates. The present version includes an alert-placement permutation benchmark and a window-resampling sensitivity analysis summarized in the results, with full tables in Appendix B. Rolling-origin validation across held-out temporal blocks, additional cross-corpus generalization tests, and validation of the Layer 1 gatekeeper remain priorities for future work. The current study does not report a full look-back-horizon sweep.
4 Results
Results are reported for the period 2017-10-01 to 2017-10-31 in the main corpus and 2017-08-01 to 2017-08-31 in the replication corpus. The primary empirical claim concerns concentration shifts. Activity-burst rows are retained to document evaluation scope: under the prospective specifications examined here, no activity-burst milestones are observed, so recall and lead time for that milestone family are not evaluable.
4.1 Window-Level Statistics
The main simulation uses a window length of 6 hours with a step size of 1 hour. Entropy is computed for 346 evaluated windows. The median number of active accounts is 6, the median number of repeated message forms is 10, and the median event count is 168. Projected account–account structures are sparse in most windows, but concentration varies substantially over time. The decline in event counts after approximately 20 October reflects exhaustion of the informative repeated-content subset, not a substantive collapse of campaign activity. From 23 October onward all windows are degenerate. Figure 1 plots the raw von Neumann entropy trajectory.
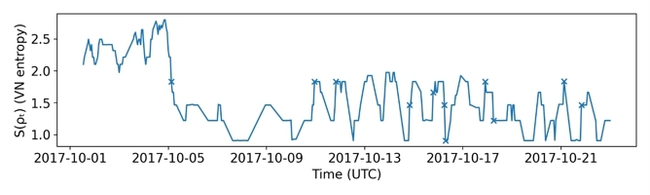
Time series plot of von Neumann graph entropy across rolling windows, with selected windows marked by alert symbols.
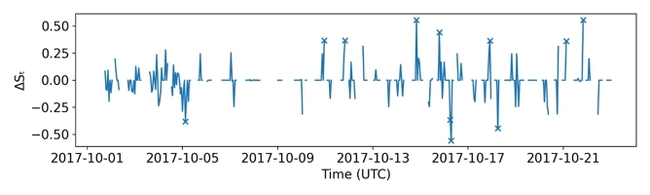
Time series plot of the first-difference entropy signal across rolling windows, with anomaly alerts marked by crosses.
4.2 Entropy Trajectories and Detected Alerts
The von Neumann entropy series does not move monotonically with message volume. SvN(t) has a mean of 1.564 and a standard deviation of 0.506. The threshold τ = 2.5 yields 9 entropy alerts. Several alerts cluster around intervals in which message reuse becomes more concentrated, suggesting that entropy responds to structural redistribution rather than throughput alone. Some of the clearest entropy deviations occur before visible increases in raw event counts, indicating that changes in the reuse-based proxy network structure can precede volume escalation. The first-difference alerting signal is shown in Figure 2.
4.3 Baseline Comparison
For concentration shifts in the October 2017 corpus, using 6-hour windows, 1-hour steps, all posts, and basic normalization, von Neumann entropy achieves recall of 0.958, 0.163 false alarms per day, and median lead time of 50 hours. The Shannon baseline achieves recall of 1.000 with 33 alerts, 0.293 false alarms per day, and median lead time of 12 hours. The volume baseline produces no valid concentration-shift detections.
The zero-alert volume result is a property of the filtered repeated-content stream, not an implementation error. The Shannon baseline fires more often and reaches perfect recall, but with shorter median lead time and higher alert burden. The von Neumann signal trades a small amount of recall for deeper lead time and lower operational overhead—a trade-off that is most favorable under the stream conditions identified in Section 5.2.
Table 4: Main comparison for concentration shifts in October 2017 (window = 6 h, step = 1 h, all posts, basic normalization).
Method | Alerts | Miles. | Recall | FAR/day | Med. lead(h) |
|---|---|---|---|---|---|
Von Neumann entropy | 9 | 24 | 0.958 | 0.163 | 50 |
Shannon entropy baseline | 33 | 24 | 1.000 | 0.293 | 12 |
Volume baseline | 0 | 24 | 0 | 0 | – |
In substantive terms, the comparison suggests not that the entropy signal is universally superior, but that in the main configuration it functions as the most useful longer-horizon structural warning signal among the methods examined here. Read together with the replication results in Section 4.5, the evidence supports a regime-dependent rather than universal advantage.
4.4 Validation and Robustness Summary
The alert-placement permutation benchmark supports the headline result. Observed recall (0.958) exceeds the 97.5th percentile of the null distribution (0.792), median lead time (50 h) exceeds the null 97.5th percentile (47 h), and the joint tail probability is 0.00001. These results do not prove broad external validity but make the observed combination of high recall and long lead time unlikely under random alert timing alone. Full permutation results are in Table 8. The window-resampling analysis and additional robustness checks are reported in Appendix B. Step-size sensitivity is reported in Table 10. A full sensitivity analysis over look-back horizons remains necessary before strong deployment claims are made for the 72-hour horizon.
4.5 Replication Check on a Second Corpus
The second corpus is the Clemson University IRA dataset released by FiveThirtyEight [9, 13], covering a distinct set of 298 account handles classified into behavioral categories absent from the Transparency Center files. We analyze August 2017 (48,861 tweets from 66 active accounts), a period of elevated activity around Charlottesville and the North Korea missile crisis.
The same pipeline is applied: 6-hour windows, 1-hour step, combined content signature, expanding 95th-percentile Herfindahl threshold. Of 739 generated windows, 417 (56.4%) are non-degenerate. Median active accounts per window is 21. Median event count is 440, substantially denser than the main corpus. Table 5 reports results.
Von Neumann entropy achieves recall of 0.750 with 29 alerts, 0.618 false alarms per day, and median lead time of 5.0 hours. Shannon entropy achieves higher recall (0.917) with fewer alerts (13), lower false-alarm rate (0.195/day), and shorter median lead time (3.5 h). The volume baseline achieves recall of 0.875 with the highest false-alarm rate (1.236/day).
Table 5: Replication check on the Clemson/FiveThirtyEight IRA corpus in August 2017 (window = 6 h, step = 1 h, combined content signature).
Method | Alerts | Miles. | Recall | FAR/day | Med. lead(h) |
|---|---|---|---|---|---|
Von Neumann entropy | 29 | 24 | 0.750 | 0.618 | 5.0 |
Shannon entropy baseline | 13 | 24 | 0.917 | 0.195 | 3.5 |
Volume baseline | 51 | 24 | 0.875 | 1.236 | 7.0 |
The change in method rankings between the two corpora is structured, not random. Three observations support this reading.
First, the performance decline of von Neumann entropy in the August corpus tracks observable stream properties measurable prospectively: the August corpus is 2.6 times denser in median events per window (440 vs. 168) and involves 3.5 times more active accounts per window (21 vs. 6). Both quantities are available from the same pipeline before any alert is issued. The Operating Conditions Framework in Section 5.2 converts these observations into testable predictions.
Second, the comparison illuminates the mechanism. In the October corpus, entropy deviations precede Herfindahl concentration shifts by approximately 15 hours on average (Appendix C). In the August corpus, the near-simultaneous structural compression and volume escalation associated with event-driven activity collapse this lead structure. The very short lead times (VN: 5.0 h, Shannon: 3.5 h) are consistent with rapid, externally triggered coordination.
Third, the replication check strengthens the core claim by identifying the operating boundary. The present results map a specific region—sparse reuse streams with sufficient relational complexity for spectral estimation—within which entropy-based monitoring provides longer-horizon structural warning at lower operational overhead. Outside that region, simpler baselines are competitive or dominant, and the two-layer architecture provides a principled fallback.
5 Discussion
5.1 Summary of Empirical Findings
Entropy Dynamics can be useful for detecting concentration changes in reuse-based proxy networks, especially in sparse streams where simple volume measures are weak. The present specification does not provide an evaluable test for generic activity bursts. Its practical value lies in conditional structural monitoring, supported by the Operating Conditions Framework for deployment decisions and by the two-layer architecture as a proposed route toward continuous monitoring.
5.2 Operating Conditions Framework
The replication check reveals a structured pattern: method rankings change with observable stream properties. This section formalizes those properties into an Operating Conditions Framework (Table 6) that indicates when von Neumann entropy is likely to outperform simpler baselines and when it is not. All predictors are measurable prospectively from the same preprocessing pipeline that produces entropy alerts. This means that deployment decisions can be made before future milestones are observed.
The first relevant condition is stream density, measured as the median number of events per non-degenerate window. In the main corpus, where the median is 168 events per window, von Neumann entropy achieves a 50-hour median lead time with 9 alerts. In the replication corpus, where the median is 440 events per window, the lead-time advantage drops to 5 hours, and Shannon entropy achieves higher recall with fewer false alarms. The approximate threshold between these regimes is therefore treated as a hypothesis derived from two corpora, not as a calibrated decision rule.
A second relevant condition is account concentration, measured as the median number of active accounts per window. Sparse account sets, such as the October 2017 corpus with a median of 6 active accounts per window, produce projected graphs in which spectral structure is more interpretable and entropy changes are more discriminative. Larger and more heterogeneous account sets, such as the August 2017 corpus with a median of 21 active accounts per window, produce denser projections in which marginal content-diversity measures become comparably informative.
A third relevant condition is monitoring coverage, measured as the share of non-degenerate windows. When coverage falls below 50%, a substantial fraction of the calendar sequence receives no Layer 2 entropy signal. In such cases, the gatekeeper and fallback components of the two-layer architecture become operationally important. When coverage is above 55%, entropy-based monitoring provides greater temporal continuity, although it remains conditional on the presence of sufficient relational structure.
Milestone type also matters. It is best treated as a boundary condition rather than as a continuous predictor. Concentration-shift milestones are more favorable to von Neumann entropy because they target relational compression that can be captured spectrally before it is fully expressed in marginal counts. Activity-burst milestones remain unevaluable in the current specification.
Table 6: Operating Conditions Framework. The entries are prospective hypotheses for future validation, not universal empirical laws.
Condition | Observable indicator and expected method strength |
|---|---|
Sparse stream | Indicator: median events/window < 200 and accounts < 10. Expected: von Neumann entropy strongest; structural compression may be visible before volume or Shannon shifts. Observed: October 2017. |
Dense event-driven stream | Indicator: median events/window > 400; exogenous triggers likely. Expected: Shannon or volume competitive; von Neumann lead-time advantage reduced. Observed: August 2017. |
Low coverage | Indicator: non-degenerate windows $< 50%$. Expected: two-layer architecture operationally important. Observed: October 2017. |
Signature uniformity | Indicator: one dominant form accounts for $> 90%$ of a window. Expected: the projected graph is spectrally uninformative and von Neumann entropy weakens. Observed: hashtag-only variant. |
Concentration milestone | Indicator: Herfindahl shift as the target. Expected: von Neumann entropy may provide longer lead time at lower alert burden. Observed: both corpora. |
The Operating Conditions Framework also functions as a diagnostic tool for interpreting negative results. If entropy-based monitoring performs poorly on a new corpus, the framework suggests a sequence of questions that can be asked prospectively. The analyst can ask whether the stream is too dense, whether coverage is too low, whether the signature definition is too uniform, or whether the targeted milestone class is an activity burst rather than a concentration shift. These questions can be answered from the preprocessing pipeline before any alert is issued.
The Operating Conditions Framework is explicitly inductive. Its predictors are stream density, account concentration, monitoring coverage, signature uniformity, and milestone type. These predictors are derived from observed performance differences across the two corpora analyzed here rather than from an independent theoretical derivation. Table 6 should therefore be read as a structured set of testable deployment hypotheses, not as a validated predictive model. There is a real circularity risk because the same two corpora that motivate the framework also provide the evidence for it. A framework induced from two cases cannot be treated as confirmed by those same cases.
This limitation does not make the framework unusable, but it defines its evidentiary status. Its practical value is that all predictors in Table 6 are measurable prospectively from the preprocessing pipeline before outcome-based method rankings are known. Stream density, active-account counts, monitoring coverage, and signature concentration can be estimated from an initial calibration prefix of a new stream without observing future milestones or alert performance. The framework can therefore generate falsifiable expectations for a new corpus rather than merely assigning labels after the fact.
A minimal validation design would proceed as follows. Given a new corpus, the analyst would estimate stream density, account concentration, signature concentration, and Layer 2 coverage from the first 20–30% of windows. The stream would then be classified as sparse, dense, low-coverage, or signature-uniform using the indicators in Table 6. Before running the full evaluation, the analyst would state a directional prediction about method ranking. Von Neumann entropy should be favored for lead time in sparse reuse streams, while Shannon entropy or volume should become competitive in denser or strongly event-driven streams. The prediction would then be compared against the observed recall, false-alarm rate, and median lead time on the remaining windows. Repeating this procedure across several corpora would test whether the framework has prospective discriminative value or merely redescribes the two cases from which it was induced. That validation remains future work. The present article contributes the framework, the operating vocabulary, and the empirical basis for testing it.
5.3 What the Framework Does Not Claim
No entropy measure can infer latent intent or distinguish organic from inauthentic coordination with certainty. All empirical claims concern changes in observable reuse patterns. Table 7 illustrates the structural nature of the signal: two windows from the replication corpus produce near-identical Herfindahl concentration and Shannon entropy but differ sharply in von Neumann entropy because their relational structures differ.
Table 7: Divergence between marginal and spectral measures in two August 2017 windows with similar Herfindahl and Shannon values but different relational structure.
Window A | Window B | |
|---|---|---|
Herfindahl Ct | 0.050 | 0.046 |
Shannon Ht | 3.07 | 3.09 |
Von Neumann SvN(t) | 2.90 | 0.00 |
Edges | 177 | 1 |
Graph density | 0.227 | 0.018 |
Structure | near-clique | dyad |
5.4 Validity Boundaries and Failure Conditions
Five conditions mark the boundary of usefulness. First, change may be driven primarily by abrupt throughput spikes without prior structural redistribution, in which case volume-based monitoring may suffice. Second, windows may be too sparse for stable spectral estimation. In the main run, 393 of 739 windows are degenerate, which is a non-marginal issue addressed operationally by the two-layer architecture but still limiting entropy-specific evidence. Third, visibility constraints may remove many bridging or high-centrality actors. Fourth, the look-back horizon may be poorly matched to the temporal scale of the signal. Fifth, signature uniformity may make the projected graph spectrally uninformative even if reuse is widespread.
5.5 Measurement Confounds
Any real monitoring pipeline faces confounds from deletions, moderation, missingness, and platform-specific visibility constraints. These can alter apparent network structure independently of underlying communication dynamics and represent an irreducible source of uncertainty in reuse-based proxy networks.
5.6 Uncertainty Quantification
The alert-placement permutation benchmark tests whether the observed recall and lead time are unlikely under random alert timing. It does not establish transportability. Window-resampling intervals in Table 9 are sensitivity summaries, not confidence intervals. Rolling-origin validation across held-out temporal blocks and broader cross-corpus comparison of alert calibration remain priorities for future work.
5.7 Pearson Cross-Correlation and Robustness
Appendix C reports Pearson cross-correlation because the diagnostic question there concerns linear lagged co-movement between two standardized time series, which is the conventional form of cross-correlation analysis. This choice should not be read as a claim that the series are Gaussian or free of outliers. Pearson correlation is retained only as a descriptive measure of linear lagged co-movement; no inferential claim depends on its exact maximum. Because rank-based Spearman and Kendall lag checks are not reported here, the approximately 15-hour peak is treated as suggestive rather than as a robust estimate. The analysis does not validate the 72-hour horizon as optimal.
5.8 External Validity
The study remains a bounded proof of concept built around one platform and a small number of temporally specific corpora. The replication check strengthens the article not by showing universal rank-order stability, but by identifying a regime-dependent pattern formalized in the Operating Conditions Framework. Stronger claims require replication on datasets with fully observed source–target diffusion edges, multilingual streams, and varied visibility regimes.
5.9 What Entropy Adds Beyond Simpler Signals
Message volume is sensitive to throughput but indifferent to whether the same volume is organized in a diffuse or compressed relational pattern. Shannon entropy captures content diversity but does not directly encode how accounts become coupled through shared reuse patterns. Von Neumann graph entropy registers that difference because it depends on the global organization of the graph state rather than on marginal counts alone [3, 7, 16]. The clearest gain appears in concentration shifts, where relational compression matters more than raw volume, and in sparse streams where that compression is structurally legible before marginal indicators react.
6 Code and Data Availability
Code, sample data, figure files, the revised manuscript source, and workflow materials are available in the project repository:
The repository currently supports inspection and demonstration of the core monitoring pipeline. The complete two-corpus data remain subject to the availability conditions of their original public sources. Additional materials required for complete numerical reproduction will be added as the replication package is finalized.
7 Conclusion
This article proposed Entropy Dynamics as a framework for early warning in reuse-based communication networks. The method represents each rolling window as a normalized graph state and tracks changes in von Neumann graph entropy over time.
The lead-time advantage is strongest in sparse streams where structural compression precedes volume escalation and simpler content-diversity shifts. In the main October 2017 corpus, Entropy Dynamics achieves recall of 0.958 with 9 alerts, 0.163 false alarms per day, and a median lead time of 50 hours. In the denser August 2017 replication corpus, the method retains meaningful recall, but the lead-time advantage drops to 5 hours and Shannon entropy and volume become more competitive. The present prospective specification does not provide an evaluable basis for claims about generic activity bursts.
The article makes three interconnected practical contributions. It provides a prospective entropy-monitoring framework for reuse-based proxy networks; it introduces an Operating Conditions Framework for identifying when entropy-based monitoring is likely to help; and it specifies a two-layer monitoring architecture that embeds conditional entropy monitoring in an always-available throughput–recurrence workflow. The first two are evaluated empirically in this proof of concept. The third is a deployment architecture whose Layer 1 gatekeeper remains to be validated.
Communication research on coordinated and adversarial online behavior benefits from tools that treat uncertainty and reorganization as measurable dynamics rather than only as obstacles to retrospective explanation [23]. Entropy-based monitoring is one such tool, provided its outputs are interpreted cautiously, evaluated prospectively, and kept separate from stronger claims about latent intent. The framework is therefore best understood as a decision-support layer for monitoring observable structural change, not as a standalone classifier of coordination or intent.
Future research should test the framework on datasets with fully observed diffusion edges, multilingual message streams, and platform settings in which bridge formation and cross-community spillover can be reconstructed directly. The key question is whether normalized state representations and entropy trajectories make network monitoring more timely and interpretable in practice—and the Operating Conditions Framework provides the vocabulary for answering it systematically.
A Preprocessing and Empirical Operationalization
Messages are normalized within each window through basic text standardization, URL handling, and construction of repeated-content signatures. Depending on the robustness variant, signatures may be based on repeated URLs, repeated hashtags, repeated text templates, or a combined content form. Accounts with no qualifying repeated-content relation in a given window may be excluded from the projected graph, and self-links are removed after projection. Sparse windows are retained for descriptive continuity but excluded from alerting when the graph operator is degenerate.
The preprocessing sequence is:
Text normalization: remove URLs, normalize whitespace, lowercase text, and remove non-functional punctuation before extracting signatures.\
Signature extraction: identify repeated text templates, URLs, hashtags, or combined signatures. An account is linked to a signature when it appears in the same rolling window after normalization.\
Degenerate-window filtering: retain sparse windows descriptively, but exclude them from entropy alerting when fewer than two active accounts or fewer than two unique signatures yield $operatorname{Tr}(L_t)=0$.\
Self-link removal: set diagonal entries of the account–account projection matrix to zero before Laplacian construction.\
Symmetrization: symmetrize projected weight matrices where asymmetric weights arise.\
In the main run, this sequence excludes 393 of 739 generated windows (53.2%) from entropy alerting and retains 346 non-degenerate windows for spectral estimation. For concentration-shift evaluation, milestones are defined prospectively from the Herfindahl concentration of repeated message forms using an expanding 95th-percentile threshold computed from prior windows only, with a fixed look-back horizon of 72 hours.
B Full Robustness and Validation Tables
Table 8: Alert-placement permutation benchmark for the headline concentration-shift result (100,000 permutations).
Metric | Observed | Null benchmark and interpretation |
|---|---|---|
Recall | 0.958 | 97.5th percentile = 0.792; above the null upper tail. |
FAR/day | 0.163 | Null median = 0.254; lower than the null median. |
Median lead time (h) | 50 | 97.5th percentile = 47; above the null upper tail. |
Joint tail probability | 0.00001 | Highly unlikely under random alert timing. |
Table 9: Window-resampling sensitivity intervals for concentration-shift metrics (1,000 resamples over non-degenerate windows).
Recall | FAR/day | Median lead (h) | ||||
|---|---|---|---|---|---|---|
Method | 2.5% | 97.5% | 2.5% | 97.5% | 2.5% | 97.5% |
Von Neumann | 0.14 | 0.75 | 0.19 | 0.48 | 13 | 53 |
Shannon | 0.92 | 1.00 | 0.48 | 0.84 | 20 | 59 |
Volume | — | — | — |
Table 10: Sensitivity to step size in the prospective specification.
Milestone | Step (h) | Alerts | Miles. | Recall | FAR/day | Med. lead (h) |
|---|---|---|---|---|---|---|
Concentration shift | 0.5 | 10 | 37 | 0.973 | 0.033 | 33.75 |
Concentration shift | 1.0 | 9 | 24 | 0.958 | 0.163 | 50 |
Activity burst | 0.5 | 10 | 0 | – | 0.330 | – |
Activity burst | 1.0 | 9 | 0 | – | 0.293 | – |
Table 11: Sensitivity to the repeated-message-form definition. Win. = windows; A = alerts; M = milestones; R = recall; L = median lead time (h).
Signature (Win.) | Method | Detection | Burden |
|---|---|---|---|
URL-only (12) | Von Neumann | A=0; M=0; R=– | FAR=0.000; L=– |
URL-only (12) | Shannon | A=0; M=0; R=– | FAR=0.000; L=– |
URL-only (12) | Volume | A=0; M=0; R=– | FAR=0.000; L=– |
Hashtag-only (62) | Von Neumann | A=3; M=0; R=– | FAR=0.109; L=– |
Hashtag-only (62) | Shannon | A=2; M=0; R=– | FAR=0.072; L=– |
Hashtag-only (62) | Volume | A=5; M=0; R=– | FAR=0.181; L=– |
Text-template (346) | Von Neumann | A=15; M=13; R=0.923 | FAR=0.540; L=16.0 |
Text-template (346) | Shannon | A=20; M=13; R=0.846 | FAR=0.720; L=15.0 |
Text-template (346) | Volume | A=15; M=13; R=0.769 | FAR=0.540; L=21.0 |
C Cross-Correlation between SvN(t) and Herfindahl Concentration
To assess the degree of dependence between SvN(t) and Ct and its temporal structure, we computed the Pearson cross-correlation between the two series over the set of non-degenerate windows. Both series were standardized before analysis. The cross-correlation at lag ℓ in hours is
where s = 1 h and Nℓ is the number of valid pairs at that lag. Positive ℓ means that Ct leads SvN(t).
Pearson cross-correlation is used here because the diagnostic target is linear lagged co-movement between two standardized time series, the conventional object of cross-correlation analysis. Because the underlying sequences may be non-Gaussian and affected by outliers, the exact lag maximum is interpreted cautiously. Spearman and Kendall lag-correlation checks are not reported in the current analysis.
Figure 3 shows the cross-correlation profile across lags from − 120 to + 120 hours. Negative lags indicate that SvN(t) leads Ct, whereas positive lags indicate that Ct leads SvN(t). The shaded interval from − 72 to − 48 hours corresponds to the prospective look-back region used in the milestone evaluation, and the dashed vertical line marks the contemporaneous lag.
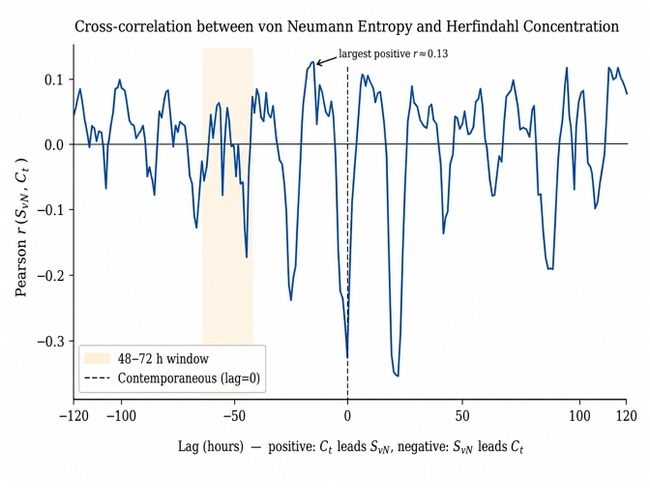
Line chart of Pearson cross-correlation between von Neumann graph entropy and Herfindahl concentration over lags from minus 120 to plus 120 hours. Negative lags indicate entropy leading concentration; a shaded band marks the minus 72 to minus 48 hour look-back region, and a dashed vertical line marks zero lag.
The results show three features. First, the contemporaneous correlation is xcorr(0) = −0.34. The negative sign is expected: lower entropy accompanies higher Herfindahl concentration. The moderate magnitude shows that the two measures overlap but are not redundant. Second, the largest positive cross-correlation (r = 0.13) occurs at lag ℓ = −15 h, which is consistent with SvN(t) leading Ct by approximately 15 hours in this descriptive analysis. Third, within the 48–72 h region used for milestone evaluation, the cross-correlation is weakly negative to near zero (r ≈ −0.05 to 0.00), suggesting that alerts issued 48–72 h before a concentration-shift milestone are not explained solely by contemporaneous linear co-movement.
These results are consistent with the alert statistic ΔSt and the milestone criterion Ct capturing related but non-identical aspects of the observed stream. They do not rule out all forms of dependence or validate the 72-hour horizon as optimal. Because a full horizon-sensitivity sweep and rank-based lag checks are not reported, all early-warning metrics remain conditional on the fixed 72-hour choice.
Source
Imported from ACM’s structured HTML source. ACM Reference Format: Władysław Błocki, Marcin Szewczyk, and Andrzej Adamski. 2026. Entropy Dynamics for Early Warning in Reuse-Based Communication Networks: Monitoring Structural Reorganization under Limited Observability. In 37th ACM Conference on Hypertext (HT '26), September 14--18, 2026, London, United Kingdom. ACM, New York, NY, USA 11 Pages. https://doi.org/10.1145/3800935.3830867
References
[1] Navid Ayoobi, Sadat Shahriar, and Arjun Mukherjee. 2024. Seeing Through AI's Lens: Enhancing Human Skepticism Towards LLM-Generated Fake News. In Proceedings of the 35th ACM Conference on Hypertext and Social Media(HT ’24). Association for Computing Machinery, New York, NY, USA, 1–11. https://doi.org/10.1145/3648188.3675136
[2] Christopher A. Bail, Brian Guay, Emily Maloney, Aidan Combs, D. Sunshine Hillygus, Friedolin Merhout, Deen Freelon, and Alexander Volfovsky. 2020. Assessing the Russian Internet Research Agency's Impact on the Political Attitudes and Behaviors of American Twitter Users in Late 2017. Proceedings of the National Academy of Sciences 117, 1 (2020), 243–250. https://doi.org/10.1073/pnas.1906420116
[3] Samuel L. Braunstein, Sibasish Ghosh, and Simone Severini. 2006. The Laplacian of a Graph as a Density Matrix: A Basic Combinatorial Approach to Separability of Mixed States. Annals of Combinatorics 10, 3 (2006), 291–317. https://doi.org/10.1007/s00026-006-0289-3
[4] Giuseppe Carrino, Angelo Di Iorio, and Davide Picca. 2024. Publishing, Linking and Translating News in Multilingual Communities: A Mirror of Cultural Differences?. In Proceedings of the 35th ACM Conference on Hypertext and Social Media(HT ’24). Association for Computing Machinery, New York, NY, USA, 106–112. https://doi.org/10.1145/3648188.3675143
[5] Despoina Chatzakou, Nicolas Kourtellis, Jeremy Blackburn, Emiliano De Cristofaro, Gianluca Stringhini, and Athena Vakali. 2017. Hate is not Binary: Studying Abusive Behavior of #GamerGate on Twitter. In Proceedings of the 28th ACM Conference on Hypertext and Social Media(HT ’17). Association for Computing Machinery, New York, NY, USA, 65–74. https://doi.org/10.1145/3078714.3078721
[6] Pin-Yu Chen, Lingfei Wu, Sijia Liu, and Indika Rajapakse. 2019. Fast Incremental von Neumann Graph Entropy Computation: Theory, Algorithm, and Applications. In Proceedings of the 36th International Conference on Machine Learning(Proceedings of Machine Learning Research, Vol. 97), Kamalika Chaudhuri and Ruslan Salakhutdinov (Eds.). PMLR, 1091–1101. https://proceedings.mlr.press/v97/chen19j.html
[7] Manlio De Domenico and Jacob Biamonte. 2016. Spectral Entropies as Information-Theoretic Tools for Complex Network Comparison. Physical Review X 6, 4 (2016), 041062. https://doi.org/10.1103/PhysRevX.6.041062
[8] Documenting the Now. 2018. Twitter Internet Research Agency Dataset. Dataset catalog record. https://catalog.docnow.io/datasets/20181204-twitter-internet-research-agency-dataset/
[9] FiveThirtyEight. 2018. Russian Troll Tweets. Dataset repository. https://github.com/fivethirtyeight/russian-troll-tweets
[10] Shreya Ghosh and Prasenjit Mitra. 2023. Catching Lies in the Act: A Framework for Early Misinformation Detection on Social Media. In Proceedings of the 34th ACM Conference on Hypertext and Social Media(HT ’23). Association for Computing Machinery, New York, NY, USA, Article 36, 12 pages. https://doi.org/10.1145/3603163.3609057
[11] Petter Holme and Jari Saramäki. 2012. Temporal Networks. Physics Reports 519, 3 (2012), 97–125. https://doi.org/10.1016/j.physrep.2012.03.001
[12] Elihu Katz and Paul F. Lazarsfeld. 1955. Personal Influence: The Part Played by People in the Flow of Mass Communications. Free Press.
[13] Darren L. Linvill and Patrick L. Warren. 2020. Troll Factories: Manufacturing Specialized Disinformation on Twitter. Political Communication 37, 4 (2020), 447–467. https://doi.org/10.1080/10584609.2020.1718257
[14] Maxwell E. McCombs and Donald L. Shaw. 1972. The Agenda-Setting Function of Mass Media. Public Opinion Quarterly 36, 2 (1972), 176–187. https://doi.org/10.1086/267990
[15] Diogo Pacheco, Pik-Mai Hui, Christopher Torres-Lugo, Bao Tran Truong, Alessandro Flammini, and Filippo Menczer. 2021. Uncovering Coordinated Networks on Social Media: Methods and Case Studies. Proceedings of the International AAAI Conference on Web and Social Media 15, 1 (2021), 455–466. https://doi.org/10.1609/icwsm.v15i1.18075
[16] Filippo Passerini and Simone Severini. 2009. Quantifying Complexity in Networks: The von Neumann Entropy. International Journal of Agent Technologies and Systems 1, 4 (2009), 58–67. https://doi.org/10.4018/jats.2009071005
[17] Stephen Ranshous, Shitian Shen, Danai Koutra, Steve Harenberg, Christos Faloutsos, and Nagiza F. Samatova. 2015. Anomaly Detection in Dynamic Networks: A Survey. Wiley Interdisciplinary Reviews: Computational Statistics 7, 3 (2015), 223–247. https://doi.org/10.1002/wics.1347
[18] Diego Sáez-Trumper. 2014. Fake Tweet Buster: A Webtool to Identify Users Promoting Fake News on Twitter. In Proceedings of the 25th ACM Conference on Hypertext and Social Media(HT ’14). Association for Computing Machinery, New York, NY, USA, 316–317. https://doi.org/10.1145/2631775.2631786
[19] Karla Schäfer and Jeong-Eun Choi. 2023. Transparency in Messengers: A Metadata Analysis Based on the Example of Telegram. In Proceedings of the 34th ACM Conference on Hypertext and Social Media(HT ’23). Association for Computing Machinery, New York, NY, USA, Article 12, 3 pages. https://doi.org/10.1145/3603163.3609034
[20] David Schoch, Franziska B. Keller, Sebastian Stier, and JungHwan Yang. 2022. Coordination Patterns Reveal Online Political Astroturfing across the World. Scientific Reports 12 (2022), 4572. https://doi.org/10.1038/s41598-022-08404-9
[21] Claude E. Shannon and Warren Weaver. 1949. The Mathematical Theory of Communication. University of Illinois Press.
[22] Karishma Sharma, Yizhou Zhang, Emilio Ferrara, and Yan Liu. 2021. Identifying Coordinated Accounts on Social Media through Hidden Influence and Group Behaviours. In Proceedings of the 27th ACM SIGKDD Conference on Knowledge Discovery & Data Mining (Virtual Event, Singapore) (KDD ’21). Association for Computing Machinery, New York, NY, USA, 1441–1451. https://doi.org/10.1145/3447548.3467391
[23] Kate Starbird, Ahmer Arif, and Tom Wilson. 2019. Disinformation as Collaborative Work: Surfacing the Participatory Nature of Strategic Information Operations. Proceedings of the ACM on Human-Computer Interaction 3, CSCW, Article 127 (2019), 26 pages. https://doi.org/10.1145/3359229
[24] Serena Tardelli, Leonardo Nizzoli, Maurizio Tesconi, Mauro Conti, Preslav Nakov, Giovanni Da San Martino, and Stefano Cresci. 2024. Temporal Dynamics of Coordinated Online Behavior: Stability, Archetypes, and Influence. Proceedings of the National Academy of Sciences 121, 20 (2024), e2307038121. https://doi.org/10.1073/pnas.2307038121
[25] Twitter. 2018. Enabling Further Research of Information Operations on Twitter. Company blog post, released October 17, 2018. https://blog.x.com/en_us/topics/company/2018/enabling-further-research-of-information-operations-on-twitter
[26] Xinyu Wang, Jiayi Li, Eesha Srivatsavaya, and Sarah Rajtmajer. 2023. Evidence of Inter-State Coordination amongst State-Backed Information Operations. Scientific Reports 13 (2023), 7716. https://doi.org/10.1038/s41598-023-34245-1
[27] Mamoru Yamakawa and Keishi Tajima. 2023. A Centrality for Social Media Users Focusing on Information-Gathering Ability. In Proceedings of the 34th ACM Conference on Hypertext and Social Media(HT ’23). Association for Computing Machinery, New York, NY, USA, Article 32, 9 pages. https://doi.org/10.1145/3603163.3609047
Do you like what you are reading? Subscribe to receive updates.
Unsubscribe anytime