
ACM source attribution. Complete text, page facsimiles, figures, tables, captions, equations, footnotes, and references were converted from the authorized ACM archival PDF for 10.1145/3511095.3536364. © 2022 Association for Computing Machinery.
Impact of Exogenous Biases of Instagram Posts on Park Visitation Estimation
Authors: Afra Mashhadi, Sana Suse, Susan Ammiri, Spencer Wood
Import kind: fulltext
Complete visual source pages



Complete text
Source page 1
Impact of Exogenous Biases of Instagram Posts on Park
Visitation Estimation
Sana Suse Computing and Software Systems, University of
Susan Ammiri University College London
Washington Bothell Bothell, Washington, USA
London, United Kingdom
Spencer A. Wood Nature & Health, University of Washington
Afra Mashhadi Computing and Software Systems, University of
Seattle, Washington, USA
Washington Bothell Bothell, Washington, USA
ABSTRACT
Recent years have seen an increase in the use of social media for various decision-making purposes in the context of urban computing and smart cities, including management of public parks. However, as use of readily available social media becomes more mainstream, a critical concern that arises is the extent to which such data remains a valid proxy for people’s online and offline behavior over time. Existing literature has mostly concentrated on the endogenous elements of the biases of social media data corresponding to platform popularity across different demographics, but failed to address the exogenous factors. In this article, we conduct a longitudinal study of park visitors and the impact of pandemic on park visitation in four US metropolitan areas. By leveraging data from Instagram and SafeGraph, we show the consequences of not accounting for both endogenous and exogenous biases that exists in approaches that rely on social media to estimate park visitation.
CCS CONCEPTS
• Human-centered computing →Empirical studies in ubiquitous and mobile computing; • Information systems →Social networking sites; Location based services.
ACM Reference Format: Sana Suse, Susan Ammiri, Spencer A. Wood, and Afra Mashhadi. 2022. Impact of Exogenous Biases of Instagram Posts on Park Visitation Estimation. In Proceedings of the 33rd ACM Conference on Hypertext and Social Media (HT ’22), June 28-July 1, 2022, Barcelona, Spain. ACM, New York, NY, USA, 6 pages. https://doi.org/10.1145/3511095.3536364
1 INTRODUCTION
Parks and green-spaces are important for the health and well-being of people in urban areas. Among the many benefits of urban parks are the opportunities to recreate, relax, exercise, socialize, and experience nature ([19, 20, 25, 27, 30, 31]). These functions have become particularly important since the onset of the COVID-19 pandemic. People seeking places to be active and socialize are relying on parks
Permission to make digital or hard copies of part or all of this work for personal or classroom use is granted without fee provided that copies are not made or distributed for profit or commercial advantage and that copies bear this notice and the full citation on the first page. Copyrights for third-party components of this work must be honored. For all other uses, contact the owner/author(s). HT ’22, June 28-July 1, 2022, Barcelona, Spain © 2022 Copyright held by the owner/author(s). ACM ISBN 978-1-4503-9233-4/22/06. https://doi.org/10.1145/3511095.3536364
and green-spaces as indoor social gatherings and recreational activities carry serious risk of transmitting the novel coronavirus. As a result, park visitation has been increasing in many places since stay-at-home orders were lifted in mid-2020 [9, 22].
While many studies have observed increases in urban park visitation since 2020, many other recent studies have reached the opposite conclusion that there is no effect of COVID-19 on park use. These findings may reflect real geographic differences in park use before and after the pandemic, or it is possible that the contrasting results are related to differences in study design and data source. To our knowledge there are no comparisons of variability in visitation among parks — both within and between cities — and factors that may be driving variability in space. Additionally, few studies have analysed trends in park visitation over time with regards to the local stay-at-home order (SAHO) guidelines and park closures that were in effect at different times in different locations [32]. Studies to date have made widespread use of proxy data from social media and mobile phone locations instead of direct on-site visitor counts. This approach is supported by evidence that the actual park visits are correlated with the popularity of urban parks on social media platforms [6, 13, 33, 35] and certain types of mobile phone location data [7, 23]. However, only some of these data sources have been validated through direct comparison with on-site estimates of park visits, and in a limited number of locations, so it is unclear whether they provide an accurate proxy for visits. Furthermore, it is feasible that the COVID pandemic and stay-at-home orders are influencing the ways that visitors use social media and mobile phones in parks. Such exogenous effects could bias the proxy data source in ways that change how it is related with actual park visits, yet this potential for “concept drift" has never been studied.
Among the several sources of proxy data, social media sites such as Instagram have been most commonly used to estimate park visitation since the onset of the pandemic. One study estimated that there has been a 5.3% increase in park use since the beginning of the pandemic, according to Instagram posts from over 100,000 users and 1,000 green-spaces in four Asian cities [9]. Other studies have analyzed data from Google’s Community Mobility Reports 2020, and observed that park visitation has increased since February 2020, compared with numbers prior to the pandemic([9]). A limited number of studies have employed a third source of data: provided by mobile phone applications that tracks user locations. Using location data from SafeGraph [11] – a company which purports to track
Source page 2
HT ’22, June 28-July 1, 2022, Barcelona, Spain Suse et al.
visits to over 7 M places including urban parks in the US — Jay et al. finds that there has been a 14% decline in visitation at urban parks in the US during the pandemic.
visitation [35]. A number of studies have emerged that have investigated the impact of the pandemic on the visitation trends. In [12], the authors studied the data from Instagram, posted at the beginning of the COVID-19 pandemic, for urban green spaces in Warsaw, Poland. They showed that during the pandemic restrictions, there was a shift towards wilder green areas, and higher intensity of use associated with those areas.
To advance this field of research, we study park visitation in the ten largest parks in four metropolitan cities in the United States, over a period of three years. In particular, we aim to answer the following research question:Has the relation between actual visits and the visit estimation based on the social media data remained consistent pre- and post-pandemic? Our hypothesis is that there are exogenous biases causing a shift in posting behavior, and such exogenous biases are creating inconsistencies in the validity of social media data as a proxy for visitation rates. Indeed, if this proxy relationship is not consistent over time, we need to be able to adjust for such inconsistencies before answering the additional question about how and why visitation has changed in space or time.
To answer this research question we apply concept drift analysis. We employ SafeGraph [11] as a benchmark data source that does not require active participation by mobile phone users, and we model its differences with social-media-based visits over time. We calculate the difference between the online (social-media-based) and offline (non-participatory based) proxies and model it as a forecasting problem. By learning the relation between these two data sources over time, we aim to study and predict trends in park use after accounting for potential changes in online behavior of visitors. Our results show that there is a large disparity between the visitation pattern that the online social network data portrays compared to that of non-participatory offline data.
2 BACKGROUND
A number of recent studies have proposed that crowd-sourced and ubiquitous data from social media can complement existing knowledge of park visitor distributions, behaviors, and preferences [10, 16]. Studies spanning an impressive diversity of urban parks and protected areas have concluded that the popularity of parks is generally mirrored in the popularity of the same destinations on multiple social media platforms [21, 29, 34]. The majority of studies quantify popularity by calculating total numbers of unique visitors per day who post geo-located Flickr photographs from a particular park over a given time period – termed “photo-user-days" (PU D) by Wood et al. (2013). A limited number of recent studies have expanded the methods to content from other platforms such as Twitter and Instagram [6, 14, 33]. The consensus emerging from these studies is that social media data has the potential to inform estimates of absolute visitation at specific destinations and for multiple time periods. That is there exists a correlation between the actual number of visitors and the estimation from the social media platform, making social media data a good proxy for park managers to rely on. Approaches for uncovering and adjusting endogenous biases (referred to as de-biasing) are fairly established and largely studied by the research community. For example, population and demographic biases are estimated based on social media platforms’ popularity and existing statistical approaches are often used to correct for that. Alternatively, using multiple data sources has been proposed as a way to help overcome these biases [15], with some preliminary evidence that it can work in practice for estimating
Geng et al. [9] use the Google Mobility Report to show that park visitation has increased since February 2020 compared to visitor numbers prior to the COVID-19 pandemic. Furthermore they show that the restrictions on social gathering, movement, and the closure of workplace and indoor recreational places, are correlated with more visits to parks. They conclude that the demand from residents for parks and outdoor green spaces hasincreased since the outbreak began, and highlights the important role and benefits provided by parks, especially urban and community parks, under the COVID- 19 pandemic. Rice et al. [26] also used Google mobility reports and found that these reported changes in park-related mobility are only partially the function of COVID-19. However, their analysis is limited to the aggregated country-region level data that is extracted by Google and lacks fine-grain analysis that is often needed by the policy makers to understand and interpret the visitation trends in different parks. In [17], the authors used SafeGraph data for 44 largest cities of the United States and show that the park visits declined by 14.6%. More interestingly they show that the reopening of the parks and the increase in visitation were associated with the white neighborhoods, suggesting that racial privilege influenced access.
Many of the existing works rely on social media data as a proxy for visitation and aim to understand the behavioral shift post pandemic. However, current de-biasing approaches have mostly concentrated on the endogenous elements of the biases on data such as platform popularity and users’ demographic. Such rationale leads to modeling biases as constant and static, thus failing to address the exogenous elements of the context in which the biases are deployed. For instance, a low visitation estimate based on Instagram, may not only be an indicator of reduction in park visits but it could also be an indicator of online behavior change (e.g., users not posting online), or offline behavior change (e.g., people spending less dwelling time in the park). In this article we address both endogenous and exogenous biases, through the methodology that is described next.
3 METHODS 3.1 Site Selection
This study compares park visitation in four US metropolitan cities: Chicago, Los Angeles, New York City (NYC), and Phoenix. Within each city, we selected the ten largest parks. We ensured that every park was designated as a local park according to the standardized designations in the Protected Areas Database of the US (PAD- US) [2], and that none were primarily sports facilities. In order to compare results per city, we compiled information on the timing of local declarations and mandates including the first emergency declaration, SAHO, and public mask mandate. The per-city information was obtained from a data repository maintained by [3, 24].
Source page 3
Impact of Exogenous Biases of Instagram Posts on Park Visitation Estimation HT ’22, June 28-July 1, 2022, Barcelona, Spain
3.2 Visitation Proxy Data
biases in social media as a proxy data source, we examined year-toyear changes in monthly PUD both before and after the date that SAHOs were enacted. This involved comparisons of year-to-year changes observed during Jan and Feb 2020, prior to the pandemic with year-to-year changes in months after SAHOs. Additionally, we calculated the percentage change of visits per month between 2019 and 2020. This approach allows us to see how parks visitation has changed since 2019, for every month, both before and after transmission of COVID-19. A consistent percentage change in PUD over every month in 2020 would indicate that Instagram’s user base was increasing or decreasing at a consistent rate, independent of COVID-19, or that the endogenous biases were perfectly balanced by an opposite effect of COVID-19 on visitation.
This study analyzed two different sources of data that could act as a proxies for park visitation:
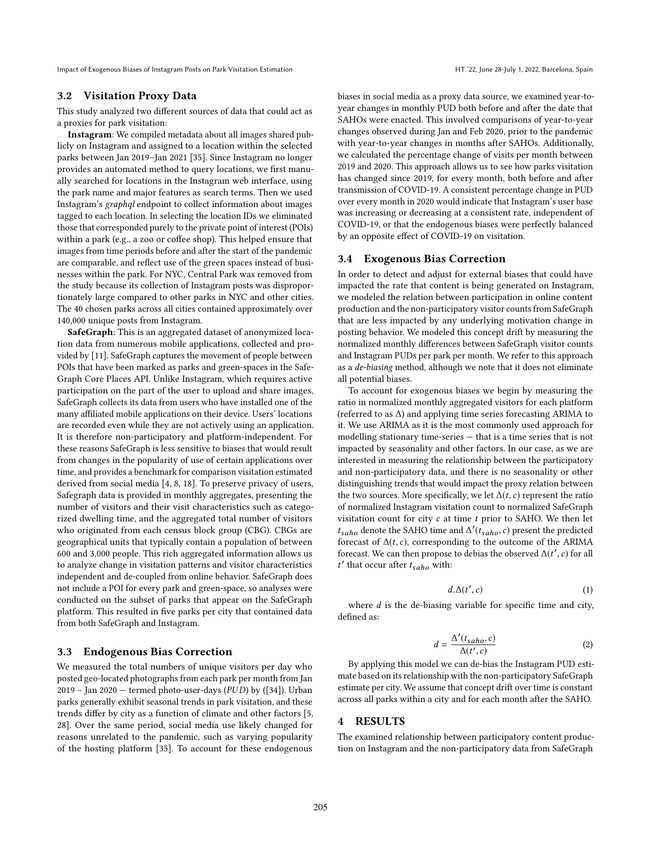
Instagram: We compiled metadata about all images shared publicly on Instagram and assigned to a location within the selected parks between Jan 2019–Jan 2021 [35]. Since Instagram no longer provides an automated method to query locations, we first manually searched for locations in the Instagram web interface, using the park name and major features as search terms. Then we used Instagram’s graphql endpoint to collect information about images tagged to each location. In selecting the location IDs we eliminated those that corresponded purely to the private point of interest (POIs) within a park (e.g., a zoo or coffee shop). This helped ensure that images from time periods before and after the start of the pandemic are comparable, and reflect use of the green spaces instead of businesses within the park. For NYC, Central Park was removed from the study because its collection of Instagram posts was disproportionately large compared to other parks in NYC and other cities. The 40 chosen parks across all cities contained approximately over 140,000 unique posts from Instagram. SafeGraph: This is an aggregated dataset of anonymized location data from numerous mobile applications, collected and provided by [11]. SafeGraph captures the movement of people between POIs that have been marked as parks and green-spaces in the Safe- Graph Core Places API. Unlike Instagram, which requires active participation on the part of the user to upload and share images, SafeGraph collects its data from users who have installed one of the many affiliated mobile applications on their device. Users’ locations are recorded even while they are not actively using an application. It is therefore non-participatory and platform-independent. For these reasons SafeGraph is less sensitive to biases that would result from changes in the popularity of use of certain applications over time, and provides a benchmark for comparison visitation estimated derived from social media [4, 8, 18]. To preserve privacy of users, Safegraph data is provided in monthly aggregates, presenting the number of visitors and their visit characteristics such as categorized dwelling time, and the aggregated total number of visitors who originated from each census block group (CBG). CBGs are geographical units that typically contain a population of between 600 and 3,000 people. This rich aggregated information allows us to analyze change in visitation patterns and visitor characteristics independent and de-coupled from online behavior. SafeGraph does not include a POI for every park and green-space, so analyses were conducted on the subset of parks that appear on the SafeGraph platform. This resulted in five parks per city that contained data from both SafeGraph and Instagram.
3.3 Endogenous Bias Correction
We measured the total numbers of unique visitors per day who posted geo-located photographs from each park per month from Jan 2019 – Jan 2020 — termed photo-user-days (PUD) by ([34]). Urban parks generally exhibit seasonal trends in park visitation, and these trends differ by city as a function of climate and other factors [5, 28]. Over the same period, social media use likely changed for reasons unrelated to the pandemic, such as varying popularity of the hosting platform [35]. To account for these endogenous
3.4 Exogenous Bias Correction
In order to detect and adjust for external biases that could have impacted the rate that content is being generated on Instagram, we modeled the relation between participation in online content production and the non-participatory visitor counts from SafeGraph that are less impacted by any underlying motivation change in posting behavior. We modeled this concept drift by measuring the normalized monthly differences between SafeGraph visitor counts and Instagram PUDs per park per month. We refer to this approach as a de-biasing method, although we note that it does not eliminate all potential biases.
To account for exogenous biases we begin by measuring the ratio in normalized monthly aggregated visitors for each platform (referred to as ∆) and applying time series forecasting ARIMA to it. We use ARIMA as it is the most commonly used approach for modelling stationary time-series — that is a time series that is not impacted by seasonality and other factors. In our case, as we are interested in measuring the relationship between the participatory and non-participatory data, and there is no seasonality or other distinguishing trends that would impact the proxy relation between the two sources. More specifically, we let ∆(t,c) represent the ratio of normalized Instagram visitation count to normalized SafeGraph visitation count for city c at time t prior to SAHO. We then let tsaho denote the SAHO time and ∆′(tsaho,c) present the predicted forecast of ∆(t,c), corresponding to the outcome of the ARIMA forecast. We can then propose to debias the observed ∆(t ′,c) for all t ′ that occur after tsaho with:
d.∆(t ′,c) (1)
where d is the de-biasing variable for specific time and city, defined as:
d = ∆′(tsaho,c)
∆(t ′,c) (2)
By applying this model we can de-bias the Instagram PUD estimate based on its relationship with the non-participatory SafeGraph estimate per city. We assume that concept drift over time is constant across all parks within a city and for each month after the SAHO.
4 RESULTS
The examined relationship between participatory content production on Instagram and the non-participatory data from SafeGraph
Source page 4
HT ’22, June 28-July 1, 2022, Barcelona, Spain Suse et al.
suggests that factors associated with the COVID-19 pandemic changed the relationship between Instagram PUD and actual park visitation. In other words, the proxy relationship between the social media data and non-participatory data dramatically changes coincident with COVID-19 due to exogenous impacts on park visitors posting behavior. Figure 1, which presents Instagram PUD and SafeGraph visits as a time series, shows that while Safegraph generally exhibits a decline in the number of visitors around the time of SAHO, Instagram PUD trends vary in the months after SAHO. In New York, there is a particularly striking difference between trends in SafeGraph and Instagram proxy counts before and after SAHO. Accounting for the exogenous bias has the effect of reducing the measured effect of COVID-19 on park visitation in all four study cities, but not the direction of the effect. Relatively large values of d in Los Angeles and NYC led to large reductions in the estimated change in pre- vs post-SAHO visitation according to Instagram PUD.
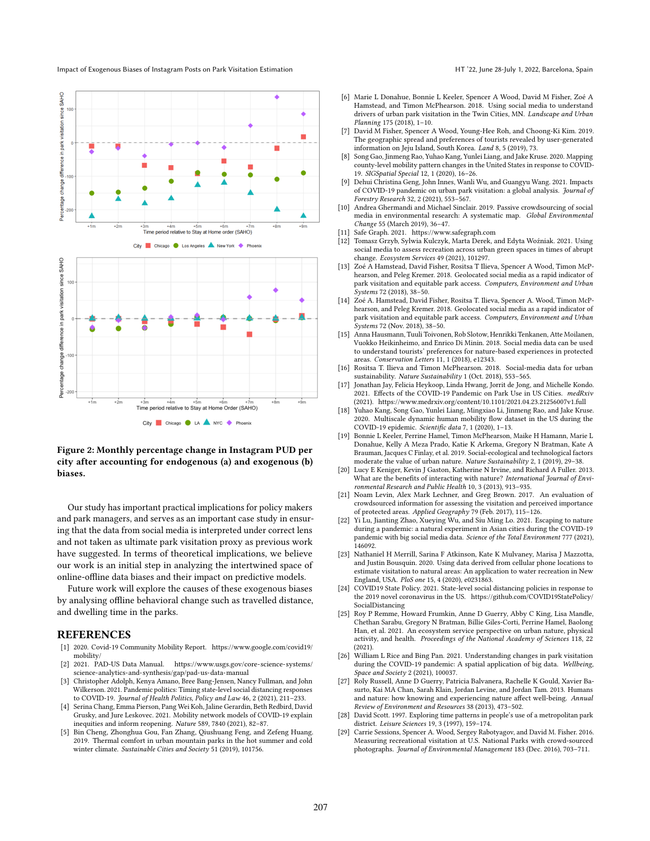
There were pre-SAHO changes in year-to-year park visitation according to PUD that were evident by comparing Jan–Mar 2019 versus the same months in 2020 (Figure 2a). These differences represent the background differences in PUD that were due to changes in the popularity of parks and social media from 2019 to 2020, independent of the COVID-19 pandemic. A general observation that can be made is that once a SAHO was enacted, the percentage change
in park visitation was lower than the change over the two months prior to the SAHO. Based on this Figure (and prior to debiasing for exogenous biases) one can interpret that in both Los Angeles and New York, visitation did not return to pre-SAHO levels. On the other hand, park use in Chicago did return to pre-SAHO levels of increasing visitation nine months after the SAHO. This result can be seen in the last red square symbol at 26% above the baseline in Figure 2a. In Phoenix there was a large increase in park visitation seven months after the SAHO. Correcting for exogenous biases, Figure 2b shows the outcome of our analysis. As it can be seen, a very different interpretation can be made regarding the park visitation changes. In the case of Figure 2b, we observe that most of the cities indeed return to their pre-level park visitation as captured by the time series trend of Safegraph data in Figure 1.
5 DISCUSSION
In this paper we studied the large impact of societal factors (namely pandemic) on the content generation of the location based social media data (namely Instagram) that relates to park visitation. Studying four metropolitan cities in the United States, we showed that the previous proxy relationship between Instagram and the benchmark non-participatory data (SafeGraph) does not remain consistent over time and is highly impacted due to the external causes.
Figure 1: Normalized monthly trends in park visitation according to SafeGraph (black) and Instagram (red), per metropolitan area. While we generally observe a sharp decline in visitation around SAHO according to SafeGraph, Instagram PUDs do not respond consistently to SAHO.
Source page 5
Impact of Exogenous Biases of Instagram Posts on Park Visitation Estimation HT ’22, June 28-July 1, 2022, Barcelona, Spain
[6] Marie L Donahue, Bonnie L Keeler, Spencer A Wood, David M Fisher, Zoé A
Hamstead, and Timon McPhearson. 2018. Using social media to understand drivers of urban park visitation in the Twin Cities, MN. Landscape and Urban Planning 175 (2018), 1–10. [7] David M Fisher, Spencer A Wood, Young-Hee Roh, and Choong-Ki Kim. 2019.
Figure 2: Monthly percentage change in Instagram PUD per city after accounting for endogenous (a) and exogenous (b) biases.
Our study has important practical implications for policy makers and park managers, and serves as an important case study in ensuring that the data from social media is interpreted under correct lens and not taken as ultimate park visitation proxy as previous work have suggested. In terms of theoretical implications, we believe our work is an initial step in analyzing the intertwined space of online-offline data biases and their impact on predictive models.
Future work will explore the causes of these exogenous biases by analysing offline behavioral change such as travelled distance, and dwelling time in the parks.
REFERENCES
[1] 2020. Covid-19 Community Mobility Report. https://www.google.com/covid19/
mobility/ [2] 2021. PAD-US Data Manual. https://www.usgs.gov/core-science-systems/ science-analytics-and-synthesis/gap/pad-us-data-manual [3] Christopher Adolph, Kenya Amano, Bree Bang-Jensen, Nancy Fullman, and John
Wilkerson. 2021. Pandemic politics: Timing state-level social distancing responses to COVID-19. Journal of Health Politics, Policy and Law 46, 2 (2021), 211–233. [4] Serina Chang, Emma Pierson, Pang Wei Koh, Jaline Gerardin, Beth Redbird, David
Grusky, and Jure Leskovec. 2021. Mobility network models of COVID-19 explain inequities and inform reopening. Nature 589, 7840 (2021), 82–87. [5] Bin Cheng, Zhonghua Gou, Fan Zhang, Qiushuang Feng, and Zefeng Huang.
Thermal comfort in urban mountain parks in the hot summer and cold winter climate. Sustainable Cities and Society 51 (2019), 101756.
The geographic spread and preferences of tourists revealed by user-generated information on Jeju Island, South Korea. Land 8, 5 (2019), 73. [8] Song Gao, Jinmeng Rao, Yuhao Kang, Yunlei Liang, and Jake Kruse. 2020. Mapping
county-level mobility pattern changes in the United States in response to COVID- 19. SIGSpatial Special 12, 1 (2020), 16–26. [9] Dehui Christina Geng, John Innes, Wanli Wu, and Guangyu Wang. 2021. Impacts
of COVID-19 pandemic on urban park visitation: a global analysis. Journal of Forestry Research 32, 2 (2021), 553–567. [10] Andrea Ghermandi and Michael Sinclair. 2019. Passive crowdsourcing of social
media in environmental research: A systematic map. Global Environmental Change 55 (March 2019), 36–47. [11] Safe Graph. 2021. https://www.safegraph.com [12] Tomasz Grzyb, Sylwia Kulczyk, Marta Derek, and Edyta Woźniak. 2021. Using
social media to assess recreation across urban green spaces in times of abrupt change. Ecosystem Services 49 (2021), 101297. [13] Zoé A Hamstead, David Fisher, Rositsa T Ilieva, Spencer A Wood, Timon McP-
hearson, and Peleg Kremer. 2018. Geolocated social media as a rapid indicator of park visitation and equitable park access. Computers, Environment and Urban Systems 72 (2018), 38–50. [14] Zoé A. Hamstead, David Fisher, Rositsa T. Ilieva, Spencer A. Wood, Timon McP-
hearson, and Peleg Kremer. 2018. Geolocated social media as a rapid indicator of park visitation and equitable park access. Computers, Environment and Urban Systems 72 (Nov. 2018), 38–50. [15] Anna Hausmann, Tuuli Toivonen, Rob Slotow, Henrikki Tenkanen, Atte Moilanen,
Vuokko Heikinheimo, and Enrico Di Minin. 2018. Social media data can be used to understand tourists’ preferences for nature-based experiences in protected areas. Conservation Letters 11, 1 (2018), e12343. [16] Rositsa T. Ilieva and Timon McPhearson. 2018. Social-media data for urban
sustainability. Nature Sustainability 1 (Oct. 2018), 553–565. [17] Jonathan Jay, Felicia Heykoop, Linda Hwang, Jorrit de Jong, and Michelle Kondo.
Effects of the COVID-19 Pandemic on Park Use in US Cities. medRxiv (2021). https://www.medrxiv.org/content/10.1101/2021.04.23.21256007v1.full [18] Yuhao Kang, Song Gao, Yunlei Liang, Mingxiao Li, Jinmeng Rao, and Jake Kruse.
Multiscale dynamic human mobility flow dataset in the US during the COVID-19 epidemic. Scientific data 7, 1 (2020), 1–13. [19] Bonnie L Keeler, Perrine Hamel, Timon McPhearson, Maike H Hamann, Marie L
Donahue, Kelly A Meza Prado, Katie K Arkema, Gregory N Bratman, Kate A Brauman, Jacques C Finlay, et al. 2019. Social-ecological and technological factors moderate the value of urban nature. Nature Sustainability 2, 1 (2019), 29–38. [20] Lucy E Keniger, Kevin J Gaston, Katherine N Irvine, and Richard A Fuller. 2013.
What are the benefits of interacting with nature? International Journal of Environmental Research and Public Health 10, 3 (2013), 913–935. [21] Noam Levin, Alex Mark Lechner, and Greg Brown. 2017. An evaluation of
crowdsourced information for assessing the visitation and perceived importance of protected areas. Applied Geography 79 (Feb. 2017), 115–126. [22] Yi Lu, Jianting Zhao, Xueying Wu, and Siu Ming Lo. 2021. Escaping to nature
during a pandemic: a natural experiment in Asian cities during the COVID-19 pandemic with big social media data. Science of the Total Environment 777 (2021), 146092. [23] Nathaniel H Merrill, Sarina F Atkinson, Kate K Mulvaney, Marisa J Mazzotta,
and Justin Bousquin. 2020. Using data derived from cellular phone locations to estimate visitation to natural areas: An application to water recreation in New England, USA. PloS one 15, 4 (2020), e0231863. [24] COVID19 State Policy. 2021. State-level social distancing policies in response to
the 2019 novel coronavirus in the US. https://github.com/COVID19StatePolicy/ SocialDistancing [25] Roy P Remme, Howard Frumkin, Anne D Guerry, Abby C King, Lisa Mandle,
Chethan Sarabu, Gregory N Bratman, Billie Giles-Corti, Perrine Hamel, Baolong Han, et al. 2021. An ecosystem service perspective on urban nature, physical activity, and health. Proceedings of the National Academy of Sciences 118, 22 (2021). [26] William L Rice and Bing Pan. 2021. Understanding changes in park visitation
during the COVID-19 pandemic: A spatial application of big data. Wellbeing, Space and Society 2 (2021), 100037. [27] Roly Russell, Anne D Guerry, Patricia Balvanera, Rachelle K Gould, Xavier Ba-
surto, Kai MA Chan, Sarah Klain, Jordan Levine, and Jordan Tam. 2013. Humans and nature: how knowing and experiencing nature affect well-being. Annual Review of Environment and Resources 38 (2013), 473–502. [28] David Scott. 1997. Exploring time patterns in people’s use of a metropolitan park
district. Leisure Sciences 19, 3 (1997), 159–174. [29] Carrie Sessions, Spencer A. Wood, Sergey Rabotyagov, and David M. Fisher. 2016.
Measuring recreational visitation at U.S. National Parks with crowd-sourced photographs. Journal of Environmental Management 183 (Dec. 2016), 703–711.
Source page 6
HT ’22, June 28-July 1, 2022, Barcelona, Spain Suse et al.
[30] Masashi Soga, Maldwyn J Evans, Kazuaki Tsuchiya, and Yuya Fukano. 2021. A
Twitter: Assessing the usability of social media data for visitor monitoring in protected areas. Scientific Reports 7 (Dec. 2017). [34] Spencer A Wood, Anne D Guerry, Jessica M Silver, and Martin Lacayo. 2013.
room with a green view: the importance of nearby nature for mental health during the COVID-19 pandemic. Ecological Applications 31, 2 (2021), e2248. [31] Monika Stodolska. 2015. Recreation for all: Providing leisure and recreation
Using social media to quantify nature-based tourism and recreation. Scientific Reports 3 (2013), 2976. [35] Spencer A Wood, Samantha G Winder, Emilia H Lia, Eric M White, Christian SL
services in multi-ethnic communities. World Leisure Journal 57, 2 (2015), 89–103. [32] Sana Suse, Afra Mashhadi, and Spencer A Wood. 2021. Effects of the COVID-19
Pandemic on Park Visitation Measured by Social Media. In Companion Publication of the 2021 Conference on Computer Supported Cooperative Work and Social Computing. 179–182. [33] Henrikki Tenkanen, Enrico Di Minin, Vuokko Heikinheimo, Anna Hausmann,
Marna Herbst, Liisa Kajala, and Tuuli Toivonen. 2017. Instagram, Flickr, or
Crowley, and Adam A Milnor. 2020. Next-generation Visitation Models using Social Media to Estimate Recreation on Public Lands. Scientific Reports 10, 1 (2020), 1–12.
Do you like what you are reading? Subscribe to receive updates.
Unsubscribe anytime