
A Centrality for Social Media Users Focusing on Information-Gathering Ability
Mamoru Yamakawa (Kyoto University, Kyoto, Japan) · Keishi Tajima (Kyoto University, Kyoto, Japan)
Published in HT '23: 34th ACM Conference on Hypertext and Social Media · DOI: 10.1145/3603163.3609047 · License: CC BY 4.0
Authors: Mamoru Yamakawa, Keishi Tajima
Keywords: Katz centrality, Twitter, graph node ranking, hub score, information propagation, retweet, social media, social network
Session: Social and Intelligent Media: Social media methods
Pages: spit
Conference: HT '23
Abstract
In this paper, we propose a centrality metric for social media users that focuses on their information-gathering ability. Existing methods of rating users in social graphs focus on various aspects of users, such as popularity, influential power, and informational quality, but these aspects are related to information-transmitting ability of users. On social media, information-gathering ability is also an important ability, which varies widely from user to user. There have been two well-known metrics related to it: the hub score in the HITS algorithm and Katz centrality. These two methods are, however, not designed for today's social media, and do not take important aspects of social media into consideration. HITS does not consider multi-hop information propagation, and Katz centrality assumes that all nodes in the graph are equally important as information sources and also as information propagation mediators. In the proposed method, we extend Katz centrality by introducing two properties of users: importance as information source and information forwarding probability. The result of our experiment on two Twitter follow graphs shows that our metric produces a ranking different from the existing metrics, and also suggests that it captures some useful aspect of users that are not captured by existing metrics.
CCS CONCEPTS
Information systems → Social networking sites.
KEYWORDS
social network, social media, Twitter, Katz centrality, hub score, retweet, information propagation, graph node ranking
ACM Reference Format
Mamoru Yamakawa and Keishi Tajima. 2023. A Centrality for Social Media Users Focusing on Information-Gathering Ability. In 34th ACM Conference on Hypertext and Social Media (HT '23), September 4–8, 2023, Rome, Italy. ACM, New York, NY, USA, 9 pages. https://doi.org/10.1145/3603163.3609047
1 INTRODUCTION
Enormous amount of information is circulated on today's social media, and we need a method for efficiently extracting useful information from it. A popular approach to that is to rank the social media users based on their estimated informational quality. For that purpose, the classic methods of rating graph nodes [10, 14] have been applied to social graphs, and there have also been many studies on the methods of estimating the informational quality of social media users [4, 6, 8, 11, 12, 15–19]. Many of them estimate the informational quality of social media users based on the assumption that users with high popularity and/or high influential power also have good informational quality. However, this assumption does not seem to always hold given the today's proliferation and popularity of fake news on social media.
One approach to avoiding this problem is to find users good at identifying good information sources, and use the popularity among them instead of simple popularity among the general public. HITS (Hypertext-Induced Topic Search) algorithm [10] is the classic most well-known method taking this approach. HITS algorithm was designed for ranking web pages, and introduced two concepts: authorities and hubs. Authorities are pages with high informational values, and hubs are pages providing many useful links to such informative pages. HITS algorithm estimates the authority score and hub score of each page based on the following assumption: good authorities are linked from many good hubs, and good hubs link to many good authorities.
HITS algorithm is, however, inappropriate for ranking social media users because HITS algorithm was designed for web pages and does not take an important aspect of social media into consideration. In social media, information is propagated through forwarding mechanisms, e.g., retweets in Twitter and share in Facebook. This mechanism is especially important in Twitter. Because of the retweet mechanism, Twitter users do not necessarily need to directly follow good information sources. In Twitter, there exist users that follow many good information sources and selectively retweet interesting tweets from them. Because of that, even if a Twitter user does not directly follow good information sources, if the user follows such information propagating users, the user can gather interesting tweets efficiently. Therefore, information gathering ability of a Twitter user depends not only on its direct followees but also on indirect followees connected through multi-hop paths, and on retweeting probability of the intermediate users on the paths. The assumption made by HITS algorithm does not take such multi-hop information propagation on social media into consideration. Therefore, we need a new metric for estimating social media users' ability of gathering useful information.
An existing metric for graph nodes that is most closely related to this ability, i.e., the social media users' ability of gathering information through multi-hop information propagation, is Katz centrality [9]. Katz centrality is used for both undirected and directed graphs, but it was originally proposed for directed graphs, and it measures the total influence to a node from all the other nodes (or total influence from a node to all the other nodes if we reverse the direction of edges) under the assumption that influence propagates through all the paths in the graph with a constant decay factor at every hop. Katz centrality, however, assumes that all nodes have equal importance as the source of influence, while the importance of nodes on the today's social media varies greatly from node to node. In addition, Katz centrality also assumes that the constant decay factor at each hop, while the probability of influence propagation, i.e., the probability that a user forwards information, also varies greatly from node to node.
In this paper, we extend Katz centrality, and define a centrality metric for social media users focusing on the ability of gathering information through multi-hop information propagation. As explained above, Katz centrality ignores two important aspects of the social media: each node has different importance as an information source, and also has different importance as an information propagation mediator, i.e., different information forwarding probability. We extend Katz centrality to include these two aspects. We also show that we can efficiently compute the proposed metric even though its formulation is more complicated than Katz centrality because of the introduction of these two factors.
Discovery of users with high information-gathering ability is useful for two purposes. First, we can use them for the discovery of good information sources as we use hubs to find authorities in HITS algorithm. Second, if a user with high information-gathering ability also retweets many interesting tweets they gathered, they are good candidates to follow. We can efficiently gather interesting tweets by following them. Therefore, discovery of such users themselves is also useful. For this second purpose, we propose another metric that considers both information-gathering ability and the user's own information forwarding probability.
We conducted an experiment on two datasets collected from Twitter. The result shows that our metric produces a user ranking that is very different from the rankings by the existing metrics. In addition, our metric has weak positive correlation with PageRank although our metric only uses out-edges of nodes, while PageRank only uses in-edges of nodes. It suggests that our metric captures some useful aspects of users. Moreover, the top 10 users in the ranking by our metric is very different from the top 10 users in the ranking by the hub score, which suggests that our metric capture some useful aspects of users that are not captured by the hub score.
Our main contributions can be summarized as follows:
We propose a new centrality metric of users in social graphs that focuses on users' ability of gathering information through multi-hop information propagation.
We show a method of efficiently computing it.
Our experimental result shows that the user ranking by our metric is different from those by the existing metrics, and also suggests that our metric captures some useful aspects of users that are not captured by the existing metrics.
2 RELATED WORK
Many metrics have been proposed for ranking nodes in a graph. In the context of complex network analysis, various definitions of "centrality" of graph nodes have been proposed.
The metric most closely related to ours is Katz centrality [9]. Katz centrality measures the status of a node in a graph by considering both direct supports from direct in-neighbors and indirect supports from nodes connected through multi-hop paths. Katz centrality has a parameter $alpha$ that represents attenuation factor at each hop. It was introduced to make the centrality scores of nodes converge.
The Katz centrality of a node can also be interpreted as the information-gathering ability of the node if we interpret the flow of the support through paths as the flow of information. The attenuation factor can be interpreted as the information forwarding probability at each node on the path. Katz centrality, however, assumes that all nodes have the same attenuation factor. In social media, some users forward information (e.g., retweet a tweet) frequently, and some users never. In this paper, we extend Katz centrality so that we can assign different forwarding probability to each node.
The original definition of Katz centrality in [9] also assumes that all nodes have the same weight as the source of support. In our context, it means that it does not distinguish important information sources and unimportant ones. Later in [7], Hubbell introduced the factor representing the exogenous input to each node, and interpreted it as the minimum score given to each node (assuming a positive adjacency matrix). The obtained model is close to a generalization of Katz centrality where each node has different weight, but the factor was not intended to mean the weight of the influence originating from the node. Hubbell [7] explains that the correspondence between Katz centrality and their model is a notational byproduct. In addition, they proposed their model not for ranking nodes but for clique identification.
Another well-known centrality metric for graph nodes is the closeness centrality [1]. The closeness centrality of a node is defined by the inverse of the average distance from the other nodes in the graph. We can interpret it as representing the average strength of the connection with the other nodes under the assumption that the strength is a function of the distance. Therefore, it may approximate the social media user's ability of gathering information from the other users. In the closeness centrality, however, even if a pair of nodes are connected through many paths, it is not reflected by the strength of their connection.
Bonacich [2] proposed eigenvector centrality, which can distinguish a node connected with others through many paths and a node connected with others through a few paths. Because nodes connected with many nodes that are also connected with many nodes are given high centrality, nodes connected with the others through many paths are given high centrality. However, eigenvector centrality is not useful when applied to directed graphs. Given a directed graph, if we use both incoming and outgoing edges to calculate eigenvector centrality, it means we interpret the graph as an undirected graph. If we only use incoming edges to estimate users' ability of gathering information, nodes without incoming edges have zero centrality, and as a result, nodes with incoming edges only from those nodes also have zero centrality. Eventually, all nodes that have no ancestors included in cycles have zero centrality.
To solve this problem, Bonacich and Lloyd proposed alpha centrality [3]. In alpha centrality, all nodes are given an exogenous score in addition to the endogenous score given from the neighbors through the incoming edges. This avoids the zero centrality problem explained above. To control the importance of the endogenous score relative to the exogenous score, a parameter $alpha$ is introduced. It is mentioned in [3] that the exogenous scores given to nodes can be different from node to node, but that aspect is not discussed further, and they assumed that the same exogenous score is given to all nodes in the rest of their paper.
Bonacich and Lloyd [3] has also shown that alpha centrality is almost identical to Katz centrality. The exogenous scores of nodes in alpha centrality corresponds to the weights of nodes as the source of support in Katz centrality, and the parameter $alpha$ in alpha centrality controlling the relative importance of exogenous score corresponds to the attenuation factor in Katz centrality. The difference between the alpha centrality score and the Katz centrality score of a node exactly equals to the exogenous score of the node (i.e., the weight of the node in Katz centrality). Therefore, if we use the uniform exogenous score for all nodes in alpha centrality and use the uniform weight for all nodes in Katz centrality, the ranking of nodes determined by these two scores are identical. If we use non-uniform ones, the two rankings are different.
In this paper, we extends Katz centrality so that we can assign different importance to nodes, and also assign different propagation probability, i.e., attenuation factor, to nodes. In alpha centrality, we cannot assign different propagation probability, i.e., different $alpha$ values, to nodes.
Another well-known metric closely related to ours is the hub score of HITS algorithm [10]. However, HITS algorithm was designed for web pages, and do not take multi-hop information flow into consideration, as explained before. A modification of HITS that replaces the adjacency matrix with its Taylor series, i.e., the sum of powers of the adjacency matrix, has been proposed in [13]. It is equivalent to extending HITS to include multi-hop information flow. However, their purpose is not to model the multi-hop information flow, but to avoid some unwanted behavior of HITS algorithm on some class of graphs.
Yet another important family of metrics for ranking nodes in a directed graph is PageRank [14] and its variants [15, 16], e.g., topic-sensitive PageRank [5]. PageRank was proposed for ranking Web pages, but it has also been shown that it is useful for estimating influential power of social media users [16]. There have also been proposals of variants of PageRank specifically designed for ranking social media users [18, 19]. PageRank and its variants are, however, inadequate for measuring the information-gathering ability of users even if we reverse the edge direction. In PageRank, we distribute the score of a node to its out-neighbors by dividing it by the number of outgoing edges. By contrast, when the information is distributed from the source, the destination node receives full information no matter how many edges are outgoing from the source node.
There have also been proposals of metrics for social media users that use various features specific to social media, such as replies and likes in Twitter [16]. These features are useful for estimating popularity or activeness of users, but not useful for estimating users' information gathering ability.
3 PROPOSED METRICS
As explained before, the metric we propose in this paper extends Katz centrality by assigning different importance weight and different forwarding probability to each node. In this section, we first explain how we estimate forwarding probability for each user. We then define the centrality metrics we propose in this paper, and also explain how we can compute it efficiently.
We explain our metrics in the following steps. We first define a metric with ignoring the existence of self-originated information. When estimating information-gathering ability of a user, we should exclude information originating the user itself and going back to it through cycles in the graph, but we first define a metric with ignoring that problem for simplicity. This metric is denoted by $IGC_+$. We then define our main metric, denoted by $IGC$, by deducting the self-originated information from $IGC_+$. Finally, we explain another metric for the second purpose explained in Section 1, i.e., a metric that considers both information-gathering ability and forwarding probability of the user. This metric is denoted by $IGC_{mathrm{rt}}$.
In this section, we explain our metrics by using the terminology in Twitter, e.g., "followers" and "retweet". We also explain how we compute information forwarding probability on Twitter. However, our metrics can be applied to any social media as long as it has a social graph and an information forwarding mechanism.
3.1 Retweet Probability
Katz centrality assumes that information arriving at a node also arrives at its out-neighbors in the constant probability. In Twitter, however, the probability that a user retweets a tweet varies largely from user to user. We estimate the retweeting probability of a user based on the ratio of the number of tweets retweeted by the user in the past to the number of all the tweets received by the user. Twitter API, however, does not allow us to obtain these numbers over the whole lifetime of a given user. We instead approximate them in the following steps. We first approximate the number of tweets retweeted by the user $i$ in the past since the creation of the user account, denoted by $T_{mathrm{RT}}(i)$, by the formula below:
where
$t(i)$ is the set of the user $i$'s recent tweets we could obtain through Twitter API,
$t_{mathrm{RT}}(i)$ is the set of retweets found in $t(i)$, and
$T(i)$ is the number of tweets posted by the user $i$ in the past since the creation of the user account, which can be obtained through Twitter API.
Note that $|t_{mathrm{RT}}(i)|/|t(i)|$ is the proportion of retweets in the tweets posted by $i$. On the other hand, $i$'s retweeting probability, denoted by $P_{mathrm{RT}}(i)$, is the proportion of tweets retweeted by $i$ in all tweets received by $i$. We approximate it by the formula below:
where $mathrm{followee}(i)$ is the set of followees of the user $i$, and $varepsilon$ is a small positive value for smoothing.
Note that $T(j)$ includes all the tweets by $j$ in the past including those posted by $j$ before $i$ added $j$ to its followee list. Therefore, if $i$ has added $j$'s to its followee list very recently after $j$'s have posted many tweets, the retweeting probability of $i$ is low even if $i$ retweets all the tweets posted by $j$'s after $i$ has added $j$'s to its followee list. In other words, $P_{mathrm{RT}}(i)$ is high when $i$ starts to follow new interesting users soon after their creation, and retweet their tweets. We use this formulation because our purpose is to give high scores to users who are good at gathering information. If a user is good at finding new interesting users soon after their creation and retweets their interesting tweets, we can efficiently collect useful information by following such a user.
3.2 Probability of Multi-hop Propagation
Given $P_{mathrm{RT}}(i)$, we calculate the probability that information posted by $u_1$ reaches $u_l$ through a $(l-1)$-hop path $p = u_1, u_2, ldots, u_l$, denoted by $P_{mathrm{RT}}(p)$, by the formula below:
Note that we do not need $P_{mathrm{RT}}(u_1)$ because $u_1$ is the user who posted the information. We also do not need $P_{mathrm{RT}}(u_l)$ because $P_{mathrm{RT}}(p)$ is the probability that the information reaches $u_l$, and it does not matter whether $u_l$ further retweets it or not.
Considering this, we define a matrix $P$ as follows:
where $A$ is the adjacency matrix of the graph where the direction of edges represents the direction of the information flow (i.e., the opposite of the follow actions), and $n$ is the number of nodes in the graph. The $(i, j)$-component of $A$ is 1 if information can flow from the user $i$ to the user $j$, in other words, if $j$ follows $i$. The $(i, j)$-component of $P$ is $A_{ij}P_{mathrm{RT}}(i)$, which represents that information that reaches the user $i$ is further propagated to $j$ in the probability $P_{mathrm{RT}}(i)$ if the edge from $i$ to $j$ exists, and in the probability 0 if the edge does not exist.
The $(i, j)$-component of the $l$-th power of $P$ divided by $P_{mathrm{RT}}(i)$, i.e., $(P^l)_{ij}/P_{mathrm{RT}}(i)$, is the sum of $P_{mathrm{RT}}(p)$ for all the $l$-hop paths $p$ from $i$ to $j$. We use it to estimate the expected amount of information that reaches $j$ through all the paths of length $l$ when $i$ posts information of the unit amount.
For example, suppose we have a graph shown in Figure 1. The matrix $P$ for this graph is shown below:

Figure 1: An example graph. Edge direction represents direction of information flow (opposite of follow direction).
Below are the $(1, 3)$-component of some of the powers of $P$:
First, $P_{13}$ shows that there is only one path of length 1 from 1 to 3, i.e., the path 1, 3. Next, $(P^2)_{13}$ shows that there is only one path of length 2 from 1 to 3, i.e., the path 1, 2, 3. On the other hand, $(P^3)_{13}$ shows that there are two paths of length 3 from 1 to 3, i.e., the path 1, 2, 4, 3 and the path 1, 3, 1, 3. Note that the path 1, 3, 1, 3 includes a cycle. $(P^4)_{13}$ also shows that there are two paths of length 4 from 1 to 3, i.e., the path 1, 2, 3, 1, 3 and the path 1, 3, 1, 2, 3. These two paths also include cycles.
Suppose information of the unit amount is posted by 1. It reaches 3 through the path 1, 2, 4, 3 in the probability $P_{mathrm{RT}}(2)P_{mathrm{RT}}(4)$, and through the path 1, 3, 1, 3 in the probability $P_{mathrm{RT}}(3)P_{mathrm{RT}}(1)$. We use the sum of these two values for estimating the information received by the user 3 through paths of length 3, as explained before. For the sum of these two values, we have:
As shown in this example, we can calculate the expected amount of information that flows from $i$ to $j$ through all the $l$-hop paths, i.e., the sum of $P_{mathrm{RT}}(p)$ for all the $l$-hop paths $p$ from $i$ to $j$, by $(P^l)_{ij}/P_{mathrm{RT}}(i)$.
3.3 Information-Gathering Ability Including Self-Originated Information
We then define the information-gathering ability of a user $i$. We first define the metric including self-originated information, denoted by $IGC_+(i)$ (Information-Gathering Centrality including self-originated information), as follows:
where $w_j$ is the weight of the user $j$ as information source, and $alpha$ is a parameter satisfying the condition $0 le alpha < 1/|lambda_{max}|$ where $lambda_{max}$ is the eigenvalue of $P$ with the largest absolute value. Note that we use $(P^l)_{ji}$, not $(P^l)_{ij}$, because we estimate the information that $i$ receives from other $j$'s.
The parameter $alpha$ can be interpreted as the attenuation factor as in Katz centrality. In our formulation, we use this parameter in addition to the information forwarding probability of each node $P_{RT}(i)$. Therefore, in our model, information posted by $j$ reaches $i$ through paths of length $l$ in the probability $(P^l)_{ji}/P_{RT}(j)$, and even when it reaches $i$, its value attenuates by a factor of $alpha^{l-1}$ because it is forwarded $l - 1$ times. If we set $alpha$ to a small value, we give priority to users who more directly follow good information sources. If we set $alpha$ to 1, we ignore the attenuation.
There are many ways to define the value of $w_j$, and we choose one of them depending on our purpose. For example, when we want to measure users' ability of gathering arbitrary information, we may use PageRank values of nodes, and when we want to measure users' ability of gathering information on a specific topic, we may use topic-sensitive PageRank [5]. We may also use metrics not based on graph structure, e.g., the average number of likes to $j$'s posts.
3.4 Computation of $IGC_+(i)$
We next show how we can compute $IGC_+(i)$ efficiently. We first define $IGC_+^t(i)$ as follows:
We can then represent $IGC_+^{t+1}$ by $IGC_+^t$ as follows:
Letting $w_p(j) = w_j / P_{mathrm{RT}}(j)$, we have:
where $overrightarrow{IGC_+^t} = (IGC_+^t(1), ldots, IGC_+^t(n))^T$ and $overrightarrow{w_p} = (w_p(1), ldots, w_p(n))^T$.
By also arranging $IGC_+^{t+1}(1), ldots, IGC_+^{t+1}(n)$ into a column vector $overrightarrow{IGC_+^{t+1}}$, we have:
We then solve this linear recurrence with constant coefficients as follows. First, we have:
Note that $(E - alpha P^T)^{-1}$ exists because we defined $alpha$ as a parameter satisfying $0 le alpha < 1/|lambda_{max}|$ where $lambda_{max}$ is the eigenvalue of $P$ with the largest absolute value. We then have:
Therefore, we finally have:
Because we defined $alpha$ as a parameter satisfying $0 le alpha < 1/|lambda_{max}|$ where $lambda_{max}$ is the eigenvalue of $P$ with the largest absolute value, no eigenvalue of $alpha P^T$ has the absolute value larger than or equal to 1. Therefore,
Therefore, the computation of $overrightarrow{IGC_+} = (IGC_+(1), ldots, IGC_+(n))^T$ can be simplified as follows:
As shown above, although $IGC_+$ allows different forwarding probability at each node and it complicates the original formulation of $IGC_+$ compared with that of Katz centrality, we can compute it almost in the same way as we compute Katz centrality. Its computation cost is close to that of Katz centrality. In other words, we have shown that we can generalize Katz centrality so that we can assign different attenuation factors at each node without incurring large additional computation costs. It is one of the main contributions of this paper.
3.5 Elimination of Self-Originated Information
The value of $IGC_+(i)$ includes the expected amount of information originating from $i$ itself and received by $i$. It is inappropriate to include it in the estimation of information-gathering ability of $i$. We define our main metric $IGC(i)$ by deducting it from $IGC_+(i)$ as follows:
where
We next show that we can compute $IGC_{mathrm{self}}$ efficiently. First, we simplify $IGC_{mathrm{self}}$ as follows:
where $otimes$ is Hadamard product, which is defined for the matrix $A$, $B$ of the same size as $A otimes B = (a_{ij} b_{ij})$. Because we have $0 < alpha$:
Because no eigenvalue of $alpha P^T$ has the absolute value larger than or equals to 1,
By arranging $IGC_{mathrm{self}}(1), ldots, IGC_{mathrm{self}}(n)$ into a column vector $overrightarrow{IGC_{mathrm{self}}}$, we obtain:
3.6 Our Main Metric $IGC$
Using the results obtained so far, we can efficiently compute our main metric $overrightarrow{IGC}$ by:
By subtracting $IGC_{mathrm{self}}$, we eliminate the expected amount of information originating from $i$ itself and finally received by $i$. When the graph includes cycles, however, information propagation paths may include cycles in the middle of the propagation. For example, in the graph shown in Figure 1, the path 1, 2, 3, 1, 3 includes a cycle 1, 2, 3, 1 in the middle. Even after we subtract $IGC_{mathrm{self}}$, $IGC$ still includes information that was propagated through such cycles. Discussion on whether we should also remove such propagation paths, and if we should, how to efficiently compute $IGC$ without including them, are research issues for future work.
3.7 Metric for Users Retweeting Useful Information
$IGC$ is a metric for measuring information-gathering ability of users. As explained in Section 1, it is useful in two ways. First, we can find good information sources by finding users followed by many users with high $IGC$. Second, if a user is good at gathering information, and also frequently retweets the useful information they gathered, the user is also a good candidate to follow. Therefore, we also define a metric that considers both the information-gathering ability and retweet probability, denoted by $IGC_{mathrm{rt}}$ ($IGC$ with retweet probability), as follows:
where $overrightarrow{P_{mathrm{RT}}} = (P_{mathrm{RT}}(1), ldots, P_{mathrm{RT}}(n))^T$. Because $IGC$ is the expected amount of information that the user gathers, and $P_{mathrm{RT}}$ is the probability that the user forwards it, $IGC_{mathrm{rt}}$ is the expected amount of information forwarded to the followers of the user.
4 EXPERIMENT
To compare the proposed metrics with existing metrics, and validate the effectiveness of the proposed metrics, we conducted experiments on two datasets collected from Twitter. Compared existing metrics are Katz centrality, the hub score in the HITS algorithm, and PageRank. In Katz centrality, we set $alpha = min{0.75, (lambda_{max})^{-1} - 10^7}$, and in PageRank, the random jump probability $epsilon$ was set to 0.15. In our methods, we set $alpha = min{0.8, (lambda_{max})^{-1} - 10^7}$, and use the PageRank value of node $j$ as $w_j$.
4.1 Dataset
The two datasets were collected in the following procedure.
Select a seed user $u$.
Retrieve all followers of $u$, and let the set consisting of those followers and $u$ be the node set $V$.
Let $E$ be the set of edges that exist between node pairs in $V$.
Retrieve 100 recent tweets by each user, which is used for the estimation of $P_{mathrm{RT}}$. For locked users whose tweets cannot be retrieved, we use the average of $P_{mathrm{RT}}$ over all unlocked users.
We created two datasets. Table 1 summarizes the statistics of two datasets and the seed users used for creating them.
Table 1: Seed Users and Statistics of Two Datasets.
|  | Dataset 1 | Dataset 2 |
| --- | --- | --- |
| seed user | @univkyoto | @A_I_News |
| number of nodes | 40,691 | 32,739 |
| number of edges | 509,978 | 456,483 |
| average $P_{\mathrm{RT}}$ | 2.58e-06 | 9.43e-07 |
4.2 Rank Correlation with Existing Metrics
We then compared the node ranking based on our $IGC$ and $IGC_{mathrm{rt}}$ with the ranking based on the existing metrics Katz centrality, the hub score in the HITS algorithm, and PageRank (PR).
In Table 2, we show the Kendall rank correlation between our two metrics, three existing metrics, and also three basic node properties: retweet probability ($P_{mathrm{RT}}$), in degree ($d^-$, i.e., the number of followers), and out degree ($d^+$, i.e., the number of followees). The top half of the table shows the result for Dataset 1 and the bottom half shows that for Dataset 2. In the following, we discuss what we can observe in the result for Dataset 1, but the same discussion holds for the result for Dataset 2.
Table 2: Kendall Rank Correlation between Three Basic Node Properties (retweeting probability $P_{mathrm{RT}}$, in-degree $d^-$, and out-degree $d^+$), Proposed Metrics ($IGC$ and $IGC_{mathrm{rt}}$), and Existing Metrics (Katz centrality, hub score in HITS algorithm, and PageRank (PR)) for Dataset 1 (top) and Dataset 2 (bottom).
Dataset 1 (top):
|  | $P_{\mathrm{RT}}$ | $d^-$ | $d^+$ | $IGC$ | $IGC_{\mathrm{rt}}$ | Katz | Hub | PR |
| --- | --- | --- | --- | --- | --- | --- | --- | --- |
| $P_{\mathrm{RT}}$ | — | −0.11 | −0.51 | −0.48 | 0.16 | −0.47 | −0.48 | −0.14 |
| $d^-$ | −0.11 | — | 0.34 | 0.18 | −0.06 | 0.31 | 0.26 | 0.89 |
| $d^+$ | −0.51 | 0.34 | — | 0.76 | 0.33 | 0.88 | 0.85 | 0.34 |
| $IGC$ | −0.48 | 0.18 | 0.76 | — | 0.37 | 0.77 | 0.87 | 0.20 |
| $IGC_{\mathrm{rt}}$ | 0.16 | −0.06 | 0.33 | 0.37 | — | 0.36 | 0.36 | −0.04 |
| Katz | −0.47 | 0.31 | 0.88 | 0.77 | 0.36 | — | 0.87 | 0.31 |
| Hub | −0.48 | 0.26 | 0.85 | 0.87 | 0.36 | 0.87 | — | 0.27 |
| PR | −0.14 | 0.89 | 0.34 | 0.20 | −0.04 | 0.31 | 0.27 | — |
Dataset 2 (bottom):
|  | $P_{\mathrm{RT}}$ | $d^-$ | $d^+$ | $IGC$ | $IGC_{\mathrm{rt}}$ | Katz | Hub | PR |
| --- | --- | --- | --- | --- | --- | --- | --- | --- |
| $P_{\mathrm{RT}}$ | — | −0.33 | −0.43 | −0.32 | 0.44 | −0.37 | −0.33 | −0.32 |
| $d^-$ | −0.33 | — | 0.55 | 0.39 | −0.08 | 0.50 | 0.40 | 0.91 |
| $d^+$ | −0.43 | 0.55 | — | 0.78 | 0.13 | 0.85 | 0.79 | 0.52 |
| $IGC$ | −0.32 | 0.39 | 0.78 | — | 0.24 | 0.79 | 0.95 | 0.37 |
| $IGC_{\mathrm{rt}}$ | 0.44 | −0.08 | 0.13 | 0.24 | — | 0.19 | 0.23 | −0.09 |
| Katz | −0.37 | 0.50 | 0.85 | 0.79 | 0.19 | — | 0.81 | 0.47 |
| Hub | −0.33 | 0.40 | 0.79 | 0.95 | 0.23 | 0.81 | — | 0.38 |
| PR | −0.32 | 0.91 | 0.52 | 0.37 | −0.09 | 0.47 | 0.38 | — |
In-degree $d^-$ and out-degree $d^+$ have modest positive correlation. It is probably because non-celebrity users in Twitter usually have many reciprocal links. Interestingly, out-degree $d^+$ has modest negative correlation with $P_{mathrm{RT}}$.
$IGC$ and $IGC_{mathrm{rt}}$ only have modest positive correlation. It is because $IGC_{mathrm{rt}} = IGC times P_{mathrm{RT}}$ and $P_{mathrm{RT}}$ has negative correlation with $IGC$. This negative correlation is the reason of the necessity of the metric $IGC_{mathrm{rt}}$. When we want to collect interesting tweets efficiently by following users who collect many interesting tweets and retweet them, we should use $IGC_{mathrm{rt}}$ instead of $IGC$ for the discovery of such users. If we simply follow users with high $IGC$ values, they are users that retweet less frequently.
As expected, $IGC$ has strong correlation with $d^+$, but this level of correlation does not necessarily mean that $IGC$ can be replaced by $d^+$. For example, their correlation (0.76) is smaller than the correlation between $d^-$ and PageRank (0.89), and we usually do not consider that PageRank can be replaced with $d^-$.
$IGC_{mathrm{rt}}$ only has modest correlation with $d^+$. It is because $P_{mathrm{RT}}$ and $d^+$ has negative correlation as explained before.
$IGC$ also has strong positive correlation with Katz centrality. It is also expected because $IGC$ is an extension of Katz centrality. However, the correlation between $IGC$ and Katz centrality (0.77) is smaller than the correlation between $IGC$ and the hub score (0.87). Considering that $IGC$ and the hub score are based on completely different ideas, higher correlation with the hub score suggests that the introduction of node weight $w_j$ and retweet probability $P_{mathrm{RT}}$ makes $IGC$ substantially different from Katz centrality. Higher correlation with the hub score also suggests that $IGC$ reflects user's information gathering ability to some extent.
It is also notable that both the hub score and $IGC$ has weak correlation with PageRank, although the hub score and $IGC$ only uses out-edges, while PageRank only uses in-edges. It suggest that both the hub score and $IGC$ capture some kind of usefulness of users, which has positive correlation with PageRank.
4.3 Detailed Comarison with Hub Score
Given that $IGC$ has strong correlation with the hub score, the next concern is whether $IGC$ captures any useful aspects of users that is not captured by the hub score. To compare the ranking by the hub score and the ranking by $IGC$ in more details, we show the comparison of top 10 users with the highest hub scores and top 10 users with the highest $IGC$ scores in Dataset 1. The left half of Table 3 shows the users with the highest hub scores, and the right half shows the users with the highest $IGC$ scores. The numbers in the cells are the ranks of the user in the ranking by the metric shown in the column header, except for the column $overline{mathrm{f.PR}}$. The column $overline{mathrm{f.PR}}$ shows the average PageRank values of the followees of the user.
Table 3: Comparison of top 10 users in the ranking by hub score (left) and top 10 users in the ranking by $IGC$ (right) for Dataset 1. The numbers in the cells are the ranks of the user in the ranking by the metric shown in the column header, except for the column $overline{mathrm{f.PR}}$. The column $overline{mathrm{f.PR}}$ shows the average PageRank values of the followees of the user.
Left half (top 10 users in the ranking by hub score):
| Hub | $P_{\mathrm{RT}}$ | $d^-$ | $d^+$ | $IGC$ | $IGC_{\mathrm{rt}}$ | Katz | PR | $\overline{\mathrm{f.PR}}$ |
| --- | --- | --- | --- | --- | --- | --- | --- | --- |
| 1 | 39412 | 2 | 1 | 4 | 24532 | 1 | 4 | 0.385 |
| 2 | 30784 | 49 | 2 | 162 | 15993 | 3 | 224 | 0.139 |
| 3 | 28591 | 490 | 7 | 300 | 13731 | 2 | 1402 | 0.039 |
| 4 | 36761 | 58 | 11 | 5160 | 23869 | 8 | 438 | 0.017 |
| 5 | 27127 | 159 | 5 | 5225 | 14223 | 5 | 584 | 0.036 |
| 6 | 30478 | 96 | 4 | 5121 | 17271 | 12 | 193 | 0.049 |
| 7 | 32345 | 47 | 13 | 5172 | 19547 | 11 | 366 | 0.014 |
| 8 | 25973 | 91 | 10 | 688 | 11804 | 6 | 581 | 0.023 |
| 9 | 26821 | 683 | 9 | 2574 | 13114 | 16 | 1500 | 0.024 |
| 10 | 27008 | 748 | 12 | 303 | 12189 | 15 | 1318 | 0.022 |
Right half (top 10 users in the ranking by $IGC$):
| $IGC$ | $P_{\mathrm{RT}}$ | $d^-$ | $d^+$ | $IGC_{\mathrm{rt}}$ | Katz | Hub | PR | $\overline{\mathrm{f.PR}}$ |
| --- | --- | --- | --- | --- | --- | --- | --- | --- |
| 1 | 35175 | 1200 | 354 | 19679 | 928 | 460 | 303 | 0.001 |
| 2 | 38853 | 3231 | 537 | 23637 | 647 | 337 | 1918 | 0.001 |
| 3 | 40444 | 307 | 289 | 26571 | 444 | 324 | 299 | 0.001 |
| 4 | 39412 | 2 | 1 | 24532 | 1 | 1 | 4 | 0.385 |
| 5 | 31209 | 112 | 31 | 14885 | 13 | 11 | 607 | 0.012 |
| 6 | 31028 | 1532 | 567 | 14718 | 1130 | 758 | 108 | 0.001 |
| 7 | 34157 | 9076 | 1255 | 18927 | 1439 | 795 | 3562 | 0.000 |
| 8 | 31389 | 691 | 244 | 15295 | 326 | 310 | 826 | 0.002 |
| 9 | 29945 | 323 | 59 | 13799 | 47 | 65 | 539 | 0.006 |
| 10 | 32659 | 7652 | 1014 | 17056 | 1799 | 742 | 3856 | 0.000 |
As shown in Table 3, top 10 users with the highest hub scores and top 10 users with the highest $IGC$ scores only have very small overlap: Only one user is common to them. These two sets of users also have very different characteristics. The users with the highest hub scores have high out-degree values (i.e., small numbers in the column $d^+$, which shows the ranks in the ranking by $d^+$), and also have high values in the column $overline{mathrm{f.PR}}$. It is expected result because nodes obtain high hub scores by directly following many good information sources.
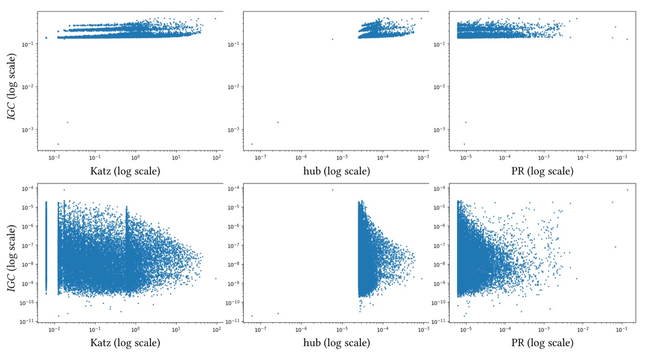
Figure 2: Scatter Plots for Dataset 1. In the top row, Y-axes are $IGC$, and in the bottom row, Y-axes are $IGC_{mathrm{rt}}$. X-axes are Katz centrality (left), hub score (center), and PageRank score (right), respectively. Both X-axes and Y-axes are in log scale.
By contrast, the users with the highest $IGC$ scores do not necessarily have high values for $d^+$ and $overline{mathrm{f.PR}}$. In spite of that, $IGC$ has positive correlation with PageRank as shown in Table 2. In Dataset 1, their correlation (0.20) is close to the correlation between the hub score and PageRank (0.27). In Dataset 2, they are almost equal (0.37 v.s. 0.38). Therefore, even though the users with the highest $IGC$ scores do not necessarily follow many good information sources directly, $IGC$ still captures some useful aspects of users, as much as the hub score does. It suggests that $IGC$ captures some useful aspects of users that are not captured by $d^+$ and $overline{mathrm{f.PR}}$, on which the hub score relies on. We presume that it is the ability of gathering information through multi-hop propagation.
Table 3 also shows that top 10 users by Katz centrality have large overlap with the top 10 users by the hub score. It also suggests that our metric captures some useful aspects of users that are not captured by the ordinary Katz centrality.
Figure 2 shows the scatter plots for Dataset 1 where x-axes are the three existing metrics, Katz centrality (left), hub score (center), and PageRank (right), respectively, and y-axes are our proposed metrics $IGC$ (top) and $IGC_{mathrm{rt}}$ (bottom). Both X-axes and Y-axes are in log scale. They also show that both $IGC$ and $IGC_{mathrm{rt}}$ are very different from these existing metrics. In particular, the plot for the hub score and $IGC$ (top center) shows that the users with highest hub scores and users with highest $IGC$ scores are very different. Similarly, the plot at top left and the plot at top right show that users with the highest Katz centrality and the users with the highest PageRank scores are also different from the users with the highest $IGC$ scores.
5 CONCLUSION
In this paper, we proposed a new centrality metric for social media users. Our metric focuses on information-gathering ability of users. The most similar existing metrics are Katz centrality and the hub score of the HITS algorithm, but they are not designed for social media users, and do not take important aspects of social media into consideration. Katz centrality assumes the uniform weight of nodes as the information source, and also assume the uniform weight as information propagation mediators. HITS does not consider multi-hop information propagation. We extended Katz centrality so that we can assign different node weights and different information forwarding probabilities to each user.
We have also shown that we can compute the proposed metric efficiently. Although its original formulation is more complicated than that of Katz centrality because of the introduction of node weights and information forwarding probability, we can simplify the formula defining our metric into a simple formula, which we can compute with almost the same computation cost as Katz centrality. Therefore, we have shown that we can extend Katz centrality so that we can assign different node weights and different attenuation factors to each node without incurring large additional computation cost. That is one of our contributions.
We compared the user rankings generated by our metrics and the rankings generated by existing metrics on two social graphs obtained from Twitter. The result shows that the rankings by our metrics do not coincide with the rankings by existing metrics. Therefore, our metric truly provide new ranking of social media users.
One interesting finding is that the ranking by our metric has weak positive correlation with the ranking by PageRank although our metrics only consider out-edges while PageRank only consider in-edges. It supports our expectation that our metric captures some kind of usefulness of users.
Top 10 users in the ranking by the hub score and top 10 users in the ranking by our metric are very different. However, the correlation between the hub score and PageRank, and the correlation between our metric and PageRank are close. It suggests that our metric can capture some useful aspects of users that are not captured by the hub score.
There are several research issues remaining for future work. The most important one is the evaluation of the usefulness of the proposed metric in some real-world applications, such as user recommendation on social media. Another remaining technical issue is the one explained at the end of Section 3.6: how to compute the metric efficiently with eliminating cycles in the middle of information propagation paths.
One thing we did not discuss in this paper is whether the proposed metric $IGC$ is also useful when we reverse the direction of edges. When we reverse the direction of edges, $IGC$ is expected to measure social media users' information-disseminating ability through multi-hop information propagation. In this paper, we use $IGC$ to measure users' information-gathering ability because the most well-known metrics for it, i.e., the hub score, does not take multi-hop information propagation into consideration. On the other hand, when we measure users' information-disseminating ability, the most well-known metric for it, i.e., PageRank, already takes multi-hop propagation into consideration. However, PageRank does not consider information forwarding probability. On social media, users with followers that frequently retweet their tweets must have greater influence. The comparison of $IGC$ and PageRank for measuring social media users' information-disseminating ability would be an interesting research issue.
ACKNOWLEDGMENTS
This work was supported by JSPS KAKENHI Grant Numbers 21H03446 and 23H03405.
References
Alex Bavelas. 1950. Communication patterns in task-oriented groups. The journal of the acoustical society of America 22, 6 (1950), 725–730.
Phillip Bonacich. 1972. Factoring and weighting approaches to status scores and clique identification. The Journal of Mathematical Sociology 2, 1 (1972), 113–120.
Phillip Bonacich and Paulette Lloyd. 2001. Eigenvector-like measures of centrality for asymmetric relations. Social Networks 23, 3 (2001), 191–201.
Daniel Gayo-Avello. 2013. Nepotistic relationships in Twitter and their impact on rank prestige algorithms. Information processing & management 49, 6 (2013), 1250–1280.
Taher H Haveliwala. 2003. Topic-sensitive pagerank: A context-sensitive ranking algorithm for web search. IEEE Transaction on Knowledge and Data Engineering 15, 4 (2003), 784–796.
Pei-Ying Huang, Hsin-Yu Liu, Chun-Ting Lin, and Pu-Jen Cheng. 2013. A Diversity-Dependent Measure for Discovering Influencers in Social Networks. In Proceedings of 9th Asia Information Retrieval Societies Conference (AIRS). 368–379.
Charles H. Hubbell. 1965. An Input-Output Approach to Clique Identification. Sociometry 28, 4 (1965), 377–399.
Lamjed Jabeur, Lynda Tamine, and Mohand Boughanem. 2012. Active Microbloggers: Identifying Influencers, Leaders and Discussers in Microblogging Networks. In Proceedings of International Symposium on String Processing and Information Retrieval (SPIRE). 111–117.
Leo Katz. 1953. A new status index derived from sociometric analysis. Psychometrika 18, 1 (1953), 39–43.
Jon M. Kleinberg. 1999. Authoritative Sources in a Hyperlinked Environment. Journal of the ACM 46, 5 (1999), 604–632.
Xiang Li, Shaoyin Cheng, Wenlong Chen, and Fan Jiang. 2013. Novel user influence measurement based on user interaction in microblog. In Proceedings of IEEE/ACM International Conference on Advances in Social Networks Analysis and Mining (ASONAM). 615–619.
Tomáš Majer and Marián Šimko. 2012. Leveraging Microblogs for Resource Ranking. In Proceedings of International Conference on Current Trends in Theory and Practice of Computer Science (SOFSEM). 518–529.
Joel C. Miller, Gregory Rae, and Fred Schaefer. 2001. Modifications of Kleinberg's HITS Algorithm Using Matrix Exponentiation and WebLog Records. In Proceedings of International ACM SIGIR Conference on Research and Development in Information Retrieval (SIGIR). 444–445.
Lawrence Page, Sergey Brin, Rajeev Motwani, and Terry Winograd. 1998. The pagerank citation ranking: Bring order to the web. Technical Report. Technical report, stanford University.
Sancheng Peng, Yongmei Zhou, Lihong Cao, Shui Yu, Jianwei Niu, and Weijia Jia. 2018. Influence analysis in social networks: A survey. Journal of Network and Computer Applications 106 (2018), 17–32.
Fabián Riquelme and Pablo González-Cantergiani. 2016. Measuring user influence on Twitter: A survey. Information processing & management 52, 5 (2016), 949–975.
Daniel Tunkelang. 2009. A Twitter analog to Pagerank. http://thenoisychannel.com/2009/01/13/a-twitter-analog-to-pagerank.
Jianshu Weng, Ee-Peng Lim, Jing Jiang, and Qi He. 2010. Twitterrank: finding topic-sensitive influential twitterers. In Proceedings of ACM International Conference on Web Search and Data Mining (WSDM). 261–270.
Yuto Yamaguchi, Tsubasa Takahashi, Toshiyuki Amagasa, and Hiroyuki Kitagawa. 2010. Turank: Twitter user ranking based on user-tweet graph analysis. In Proceedings of International Conference on Web Information System Engineering (WISE). 240–253.
Do you like what you are reading? Subscribe to receive updates.
Unsubscribe anytime