
Comparison of news commonality and churn in international news outlets with TARO
Giuseppe Carrino (University of Bologna, Bologna, Italy), Angelo Di Iorio (University of Bologna, Bologna, Italy), and Gioele Barabucci (Norwegian University of Science and Technology, Trondheim, Norway). All authors contributed equally to this research.
Published in HT '23: 34th ACM Conference on Hypertext and Social Media · DOI: 10.1145/3603163.3609062 · License: © Copyright held by the owner/author(s). Publication rights licensed to ACM.
Authors: Giuseppe Carrino, Gioele Barabucci, Angelo Di Iorio
Keywords: Computational journalism, churnalism, news analysis, news churn, news diffusion, online news publication
Session: Workflows and Infrastructures: Curation and editions
Abstract
The past decades have seen an increase in academic research and public debates on online news and journalism in general, with an emphasis on fake news and low-quality reporting. This paper presents TARO: a model and a software framework for the collection and analysis of online news sources. The novel aspects of the TARO model and framework are: the distinction between abstract pieces of news and concrete news items, news comparison techniques based on similarity on embedded spaces, and the management of rolling news via so-called snapshot extensions. One advantage of TARO is the ability to perform comparative analysis of international news sources in various languages and across time zones. To prove the applicability and soundness of TARO, two quantitative cases studies related to the concept of churnalism are also presented in this paper. The two case studies provide quantitative insights on two tendencies of news outlets: news commonality (publishing the same news) and news churn (quickly removing recent news to make space for even more recent news).
Ccs Concepts
• Information systems →Content analysis and feature selection; • Applied computing →Document analysis; Publishing; • Computing methodologies →Information extraction.
Keywords
Computational journalism, churnalism, news churn, news analysis, news diffusion, online news publication
∗All authors contributed equally to this research.
Gioele Barabucci∗
gioele.barbucci@ntnu.no Norwegian University of Science and Technology Trondheim, Norway
1 INTRODUCTION
It is common for "the same news" to be published and republished by different outlets, across different paradigms (Web articles, video news, printed articles, social media posts), different languages and, most importantly, from different angles. [1, 6] The speed at which news nowadays spread is both a blessing (news is able to reach many people from different countries all around the world) and a curse (news outlets are constantly publishing new of pieces of news, often republished from other outlets with little critical analysis). News aggregators such as Google News can alleviate some of these issues, by collecting "the same news" from a myriad of different channels and making it accessible in summary form to a vast audience. However, news aggregators can relay a distorted image of the news. The news that they aggregate are the news currently published by the news outlets. In a global news landscape, though, this "instantaneous" aggregation can and often does break down. Take for example an event reported by, say, an Egyptian news website. It can take days if not weeks for it to percolate through the global news system and end up, after translations, adaptations, fact checking, in a US prime-time newscast. By the time that piece of news got published in the US, the Egyptian news website will have had moved on. At that point, an aggregator looking only at current articles would not take into account the original article and not show it to its users as one of the possible sources. In an ironic twist, the new articles that forced the original article out of the Egyptian news website are likely to be articles coming from US outlets. There is a wonderful term that capture such a phenomenon: churnalism[2]. Coined by the BBC journalist Waseem Zakir by fusing the terms "churn" and "journalism", churnalism indicates a form of journalism in which the reporters create articles just by reporting press releases and already published material. The connotation is clearly negative but it can be argued that it also have a positive effect: given that the “churn rate” measures the ability of news publishers to frequently change their published news[8], it may indicate their willingness to be up-to-date, to follow events, and to inform their audience about as many events as possible. The motivation behind this work is the will to capture the different nuances of "churnalism" and its effects on online news publishers in a systematic, quantitative, and reproducible way. To do so, we had to face two fundamental issues. First and foremost, we had to define what "the same news" means and how it can be computed, considering that news items might be similar in their message, but published on different channels (es. CNN vs BBC) or
written in different languages (English in BBC Worlds vs Spanish in BBC Mundo). Second, we had to include a temporal dimension that captures the fact that different outlets might publish the same news at very different times (due to information propagation delays, editorial choices, or time zones and working hours). Considering a limited timeframe - like Google News and other aggregators do - is not sufficient. Rather we need a way to compare different "time windows" when searching for the “same news". The key contribution of this paper is a model for the formalization of online news that allows the comparison of pieces of news across news outlets, time spots and languages, allowing us to understand how "the same news" has been treated by different outlets. On top of this model we have described two metrics that capture the two dimensions underlying churnalism: diffusion (how many outlets publish the same news) and permanence (how long the same news remains published by an outlet). We named our model TARO, which is an acronym for Tons of Articles Ready to Outline but also a tribute to Gerda Taro, German Jewish photojournalist active during the Spanish Civil War. To validate this model, we also present a proof-of-concept implementation of TARO. The software combines NLP techniques, entity recognition and automatic translation to detect "the same news" in multiple outlets, and to calculate metrics on news diffusion and permanence. In perspective, the same implementation can be used to quantify and analyze many other aspects of the ways in which news is produced and published. The goal of this paper is to present the foundations of the framework and to assess its applicability on some case case studies. The next step will be to improve the implementation and to perform larger experiments, so as to provide a toolkit for different classes of users involved in journalism. A better understanding of the dynamics of publishing and republishing of (non-)original content might be of great help for news outlets that will be able to self-monitor their performance and those of their competitors. The same analysis can be valuable for readers - to scan news in a more critical way - and for journalism scholars - to study publication processes in depth. In general, we think that this research field could be interesting for the improvement of the actual newspaper communication system, to develop a way to publish news online that is more informative for both final users and journalists. This is indeed meaningful in a context where major differences between paper and online articles fruition have already been shown [10], but analysis on internet newspapers practices are not completely exploited. Our questions are (1) if there are relevant differences in publication tendencies between times of the day and (2) if newspapers can be clustered considering their news coverage The paper is then structured as follows. Section 2 briefly illustrates the main challenges of our approach, introducing some background terminology. The model is formally described in Section 3, while our tool-chain is presented in Section 4. The application of TARO to two case studies is presented in Sections 5 and 6, before discussing some threats to validity, related works and conclusions.
2 CHURNALISM IN PRACTICE: CHALLENGES
Before delving into the details of the formalism, we provide here an intuition of the problems posed by the quantitative analysis of churnalism and of news in general. Our goal is to reframe the discussion about churnalism in more quantitative and neutral terms. For example, how valid is the claim that all mayor news websites just republish the same news? Are we talking about the existence of a small core of important news pieces reported by all news outlets, or do the data show that pretty much the totality of reported news are the same across all publishers? Data like this will provide scholars of journalism with a more objective platform to discuss both the negative and the positive repercussions of churnalism in a more substantiated way. For instance, is the fact that a sizeable chunk of the international political news is the same across all major US newspapers a good or a bad thing? On the one hand one could argue that it is bad because it shows an unhealthy level of homogeneity and lack of diversity in news topics. On the other hand one could argue that it is good because it means that citizens have been able to hear about a certain event regardless of their choice of news outlet, reducing the "news bubble" effect. Without data, the answers to these questions are a matter of policy and beliefs. On the contrary, the presence of hard data will allow scholars to carry out quantitative experiments. A quantitative study could, for example, arrive to the conclusion that that levels of similarity under 25% are unhealthy (lack of a shared common base of news among the population) but that also levels above 90% are problematic (lack of out-of-the-box reporting).1
2.1 Defining churnalism: diffusion and persistence of news
Practically speaking, what we aim to quantify in this paper are two observable dimensions of the news publishing process that are associated with churnalism: the diffusion of single pieces of news across news outlets and their persistence over time. The diffusion of a piece of news published by an outlet can be analyzed by looking at the number of "common" (published also by other outlets in addition to the one being considered), "exclusive" (published only by the news outlet being considered), or "skipped" (published by other outlets but not by the one being considered). Figure 1 shows an example of skipped, common and exclusive news, given a base newspaper (red borders) and two other outlets (black dotted borders). The persistence dimension, instead, tells us how quickly a piece of news is discarded from a news outlet after its first publication there. For instance, for online news outlets persistence indicates how long a piece of news has been left on their website, while for TV news it indicates after how many many broadcasts that piece of news stopped being aired. More formal definitions of diffusion and persistence are given in Section 3.
1This is just an illustrative example; the numbers in this sentence are made up and not based on any evidence.
2.2 Challenges in analyzing churnalism
Calculating diffusion and persistence is, however, not straightforward. First of all, detecting whether two different concrete news items, say two articles on the same topic written by two different journalists, are actually "the same piece of news" is a complex endeavour, mostly because it requires the formalization of an equivalence relationship for news items. In turn, formalizing an equivalence relationship for news items requires answering many tough questions, both epistemological questions such as:
• can two news items be "the same news" if they only briefly touch upon the same subject?
• can they be considered as equivalent if they talk about the same subject but one is a neutral report while the other is an hostile editorial?
• what if an article discusses only one topic while the other also discusses an additional second topic? as well as technical questions:
Figure 1: Examples of exclusive (star) / common (rectangle) / skipped (cloud) news of one newspaper compared to two others
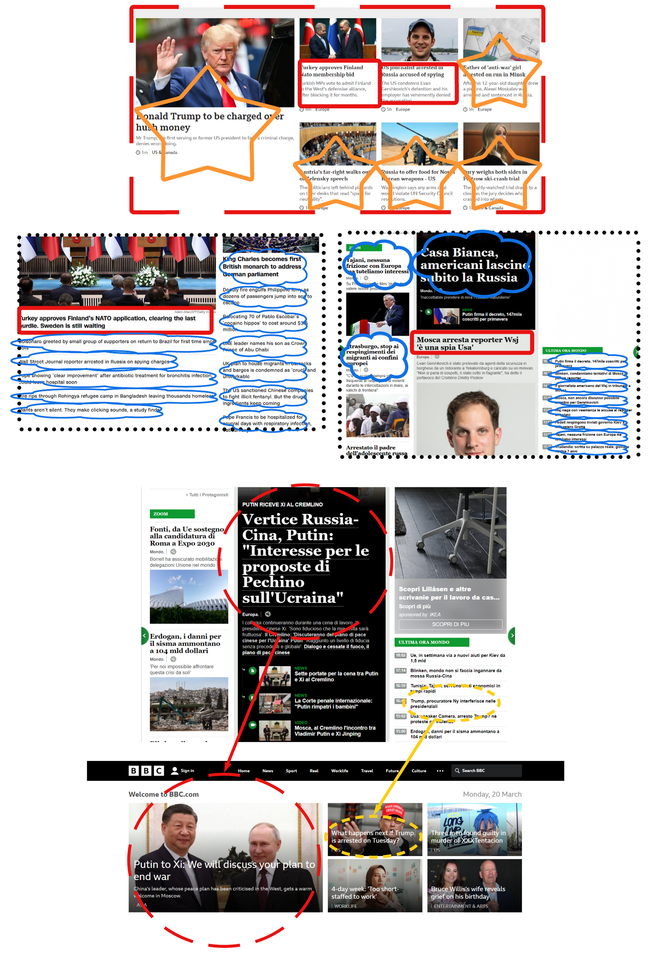
• how can the list of topics be extracted from an article? • how can a meaningful similarity threshold be identified? • in the case of articles written in different languages (Figure 2), should the articles be translated? To which language? Figure 2: Example of the same news, in different languages
Another challenge is collecting the news articles in a way that makes it possible for them to be compared in a meaningful way. Particularly difficult is capturing constantly changing, rolling news sources like news-only TV channels or frequently updated websites. A common solution to this problem is the use of snapshots: i.e., considering all the news items available at a certain point in time at a certain location, say the homepage of the website of a news outlet, as a coherent unit of publication.[12] This simple device of creating snapshots can be seen as an arbitrary process but it greatly simplifies the process of collecting the news and makes it possible to treat rolling news source like more traditional news edition such as evening newscasts or printed daily newspapers. Comparing news sources using simple snapshots, however, gives rise to various issues, the most glaring of which is the inability to recognize a piece of news as the same across different sources if these sources publish it at different times. Take for example the situation illustrated in Figure 3. Both Outlet 1 and Outlet 2 have published the same two pieces of news: blue/dashed and red/dotted. But while there are at least two snapshots (vertical lines) that recorded the red/dotted piece of news as presented at both outlets, there is no snapshot that recorded the fact that both outlets have published the blue/dashed piece of news. Any analysis that looks at one snapshot at a time will thus not be able to correctly determine that both outlets published both pieces of news.
Figure 3: Articles persistence challenges overall exclusivity computation
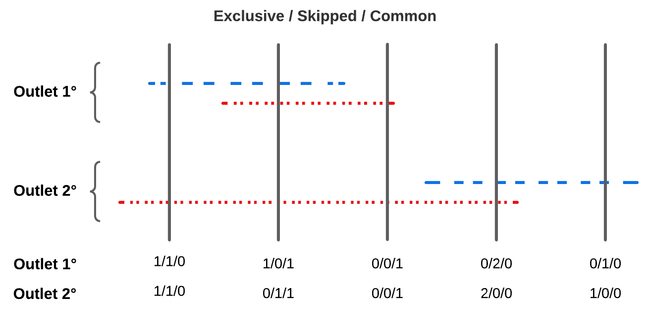
To address this problem snapshot extensions are used instead of plain snapshots in TARO. Snapshots extensions are synthetic snapshots created through the union of multiple snapshots taking at adjacent points in time. While plain snapshots represent news published by a source at a specific instant, snapshot extensions represent the totality of the news published by a source in a certain timespan. Clearly, to avoid the inclusion of duplicates in the snapshot extensions, the creation of snapshot extensions hinges on the existence of an equivalence relationship whose challenges have been discussed in the previous paragraphs.
3 FORMALIZATION
In order to be able to quantify the qualities of the news articles that are being analyzed and to identify various phenomena, we rely on the set of semi-formal definitions provided in this section. These definitions also form the basis of the data structures and algorithms employed by TARO.
3.1 News items and pieces of news
In TARO there is a distinction between the abstract concept of a piece of news and its representation in textual, video, or audio form as a news items.
Definition 3.1. Piece of news: An abstract entity representing an event that is being reported. An opaque identifier is associated to each piece of news. Examples of pieces of news are "Anniversary of moon landing", "Opening of semiconductor fabrication plant", or "Union strike for increase of wages".
Definition 3.2. News item: A concrete entity that embodies a piece of news and represents it using natural language. Examples of news items are the different newspaper articles discussing the piece of news "Anniversary of moon landing".
3.2 News outlets and publishing systems
Definition 3.3. News outlet: An entity that published news items, for example TV broadcasters, newspapers, or press agencies. Examples of news outlet are "CNN", "Le Monde", "Associated Press". Properties of a news outlet:
country The country associated with the news outlet, usually where its headquarters are located.
language The natural language in which the news items produced by the news outlet are written. The TARO model assumes that a news outlet publishes news items in a single language. When a news outlet publishes news items in more than a language, each language is seen as a separate outlet, for example "CNN", "CNN (Spanish)".
Definition 3.4. Publishing system: The way in which a news outlet published news items. There are two kinds of publishing systems: news editions and news flows.
Definition 3.5. News edition: News editions are bundles of news items all published together at a specific point in time. Examples of news editions are evening news TV programs or newspapers.
Definition 3.6. News flows: News flows are boundary-less streams of news items that gradually get replaced. Examples of news flows are rolling news, stock tickers, or the home pages of the websites of press agencies.
3.3 Snapshots
Definition 3.7. Snapshot: A set of news items published by a news outlet at a specific time. For news outlets that publish news editions, a snapshot is equivalent to a specific news edition. For instance, "the edition of Le monde published on 2023-03-16" or "the NBC Nightly News aired on 2023-03-13".
For news outlets that publish news flows, a snapshot is the collection of all news published by the news outlet at a specific time. Examples of news flow snapshots are "the RSS feed of PBS News, as appeared online at 2023-03-14 17:15:00 UTC". Properties of a snapshot:
outlet The outlet that has published the news items included in the snapshot.
publication time The date and time when the snapshot has been first published (news edition) or retrieved (news flow).
topic A description of the subject common to all news items present in the snapshot. The topic is omitted for snapshots whose news items span multiple subjects. Certain analyses need to look at news items published over an extended period of time as if they were published in a single point in time. In such cases, snapshot extensions are used in place of simple snapshots. An example of a kind of analysis that works on the basis of news collected over extended periods of time is finding out if a certain piece of news has been covered exclusively by a specific news outlet.
Definition 3.8. Snapshot extension: A synthetic snapshot created by merging different snapshots and removing duplicated news items.
3.4 News comparison and identity
The core activity at the center of all analyses performed in TARO is comparing concrete news items to understand if they reference the same abstract piece of news. The "sameness" of two news items is formally defined by an equivalence relation.
Definition 3.9. Equivalence: Two news items are equivalent if they discuss the same piece of news, regardless of the language in which they are written, the media in which they encoded, the time in which they have been published, etc. Establishing if two news items are equivalent can be done in two ways: through a comparison of their identities or by calculating their similarity, i.e., their distance in an embedding space.
Definition 3.10. Equivalence through identity: Given an identity function 𝑖𝑑(𝑎) that operates on news items and returns an identifier that uniquely identify the piece of news they are are taking about, two pieces of news 𝑛and 𝑚are equivalent iff 𝑖𝑑(𝑛) == 𝑖𝑑(𝑚).
Definition 3.11. Equivalence through similarity: Given a) an embedding function 𝑒𝑚𝑏𝑒𝑑(𝑎) that projects a news item into a metric space 𝑀, b) a distance function 𝑑𝑖𝑠𝑡(𝑥,𝑦) that calculates the distance between two points 𝑥and 𝑦in 𝑀, and c) a threshold, two pieces of news 𝑛and 𝑚are equivalent if |𝑑𝑖𝑠𝑡(𝑛,𝑚)| < 𝑡ℎ𝑟𝑒𝑠ℎ𝑜𝑙𝑑.
3.5 News diffusion and persistence
To carry out the analyses on churnalism described in the introductory sections, two metrics are needed: diffusion (how many outlets published a certain piece of news) and persistence (how long has a piece of news been published by an outlet). These two metrics will be calculated using the definitions previously presented in this section. The diffusion metric indicates how many outlets published a certain piece of news. Its value is influenced in particular by the
choice of the snapshots taken into account during its calculation: the selection of news outlets from which the snapshots are originated and the sampling of the snapshot themselves change the way in which news items are compared and thus counted.
Definition 3.12. Diffusion: The diffusion of a piece of news in a snapshot extension is the number of outlets whose snapshots contains at least one news item covering that piece of news. Once the diffusion of a piece of news is known, it is possible to classify the news items published by an outlet as exclusive (published by only one outlet), common (published by two or more outlets), or skipped (not published by the outlet being considered).
Definition 3.13. Exclusive piece of news: Given a news outlet 𝑂, a piece of news 𝑛is said to be exclusive to 𝑂if the diffusion of 𝑛is 1, and 𝑚included in at least one snapshot of 𝑂.
Definition 3.14. Common piece of news: A piece of news is said to be common if its diffusion greater or equal to 2.
Definition 3.15. Skipped piece of news: Given a news outlet 𝑂, a piece of news 𝑛is said to be skipped by 𝑂if the diffusion of 𝑚is at least 1 and 𝑛is not included in any snapshot of 𝑂. The persistence metric indicates how long a piece of news has been published by a news outlet, for example by being displayed on the outlet’s website or by being broadcast in news broadcasts.
Definition 3.16. Persistence: The persistence of a piece of news 𝑛 in a news outlet 𝑂is the number of snapshots of 𝑂that include 𝑛. Given the way in which the snapshots are created (i.e., scraped at fixed intervals), it is possible to the persistence value to estimate how long (in hours or days) a piece of news has been published.
4 METHODS AND IMPLEMENTATION
On top of our model, we implemented a pipeline that automatically analyzes the diffusion and persistence dimensions across multiple news outlets. We describe here how the data used to carry out the analyses presented in Sections 5 and 6 has been collected. We also describe the implementation of the news comparison algorithm that is used in case study 1 (Section 5) and case study 2 (Section 6) to match news across outlets and to deduplicate them during the creation of extended snapshots.
4.1 Data collection
The data used in the analysis described in section 5 and section 6 have been gathered by collecting and scraping various news outlets that publish news flows:
• ABC (ES, Spanish) • ANSA (IT, Italian) • BBC (UK, English)
• France24 (FR, French) • Spiegel (DE, German) • il Post (IT, Italian)
Collectively, these outlets represent a wide variety of countries and languages. However, all these sources are based in Europe, with a difference in time-zones of at most 1 hour, so that all the comparisons could be performed normalizing on CET: a suitable choice for an initial analysis.
The only country with two chosen newspapers is Italy: ANSA and il Post. This choice, which is undoubtedly unbalanced, is however justified by two reasons:
• The two sources are deeply different, since ANSA is a news agency and il Post is more op-ed based, which allows meaningful comparisons on editorial lines
• It has been possible to compare "by hand" their pairs of articles without translation, to establish its impact on analysis more easily All the news items have been sourced from the World sections of these outlets: this specific topic has been chosen because common among all outlets and, thus, making it possible to establish an homogeneous set of news. The articles have been scraped every 15 minutes for various months. The subset of data used for the case studies presented in this paper2 cover a timespan of one to three days (March 16, 17 and 18, 2023) and are just supposed, to give an idea of our approach. This short timespan is justified, first, by the fact that the aim of this paper is to present the TARO model and prove its soundness, not to carry out a proper journalistic analysis, and second, by the low probability that a specific piece of news is going to be published by an outlet days after its first appearance on another outlet. Future work will provide more exact data on this phenomenon and extend the experiments proposed here to a larger dataset. Most of these snapshots have been created using outlet-specific spiders written in Python and Scrapy.3 These spiders collect information on all the articles currently published, such as title, subtitle, content and URL, other than all metadata such as their publication date, source and language. In a minority of cases, RSS feeds have been used instead of scraped data. Manual validation has confirmed the congruence between the content of the RSS feeds and the news published on the website. Regardless of the method used to gather the news from the outlets, all data has been normalized and stored in JSON files using an ad-hoc schema.
4.2 Subject-based news comparison in TARO
A foundational component of all analysis performed in TARO is the comparison of news items. News comparison is used, for instance, to create the union set containing all pieces of news published by all news outlet. In this version of TARO, the computation of exclusivity and churn rate of an outlet is directly dependent to a equivalence measure, which is defined as a function that, given two news items, calculate the closeness between them, semantically speaking - if this value exceeds a given threshold, the two articles are defined as equivalent through similarity, so they refer to the same piece of news. The current method for this computation is based on the cosine similarity measure. [5, Chapter 6.3] Firstly, term frequency-inverse document frequency vectors (TF- IDF vectors, [5, Chapter 6.2]) are prepared for the items, after a process of lemmization, then the distance between them is computed
2The datasets are available at https://doi.org/10.5281/zenodo.8146514. 3https://scrapy.org/
using the before-mentioned cosine similarity formula. Considering 𝐴and 𝐵as the vectors of terms for the items to compare:
cos(𝜃) = 𝐴· 𝐵
∥𝐴∥2 ∥𝐵∥2 (1)
𝑐𝑜𝑠(𝜃) is the reciprocal of 𝑑𝑖𝑠𝑡(𝐴, 𝐵), so the equivalence between the items is established according to a properly set threshold. This whole process is done thanks to the library SpaCy4, that also offers different packages for a multitude of languages. However, the quality of the conceptualization for tongues different than english is not always exhaustive, so the solution was the translation of all the collected artifacts before the analysis. This approach, anyway, leads to a possible threat to validity caused by the translation itself. For a possible improvement of this, see Section 7. All the analysis presented subsequently are formulated by the execution of the similarity measure described before, applied interoutlets (for the SkippedCommonExclusive Index) and intra-outlet (for the Churn Rate), in different days and at different times, in order to gain information on the editorial line of the chosen sources.
5 CASE STUDY 1: NEWS COMMONALITY
The first experiment we performed aimed at studying the exclusivity of reported news, expressed in terms of common, exclusive and skipped news. The aim of this analysis is to quantify the tendency of a news outlet to carry the same news as the other outlets (commonality) or to publish news that no other outlets published (exclusivity). The analysis was limited to one single day (March 23rd, 2023) but gave us valuable indications about the applicability of our approach. Five outlets were taken into account (ABC, BBC, Spiegel, France24, and il Post) for a total of 196 news items collected in 24 hours starting at 8:00 AM. The 15-minute snapshots were combined in different extended snapshots of 2, 6 and 24 hours. Then, we were able to compare the behaviour of these outlets during the day. Figure 4 shows the results considering all news collected in the timespan 8:00 AM - 10:00 AM. Each circle represents an outlet, the X axis indicates the number of skipped news, while the Y axis indicates the number of covered news. The radius of each circle is proportional to the number of exclusive news, which is also reported in the legend. Spiegel and il Post tend to publish news frequently and in fact showed the highest coverage in the day we observed. The position of BBC - on the right-bottom side - is meaningful too: it indicates that the outlet published a limited number of news in the early morning (Rome timezone). The diagram also shows that ABC was the most active in publishing exclusive news, which were mostly related to the US political debate. Figure 5 shows the results on a 6-hours extended snapshot. These are in line with the previous ones, since the relative position of the outlets does not change. It is very interesting to note that BBC is now much closer to the others. This indicates that the editors published the same news of the others but later in the morning. The number of BBC exclusive news also increased, and this also confirms the editorial activities of the outlet at this time of the day. The same trend is evident in Figure 6. The overall number of news obviously increased but the relative position of the outlets remain
4https://spacy.io/
Figure 4: Commonality within an extended snapshot of 2 hours (8:00am - 10:00am)
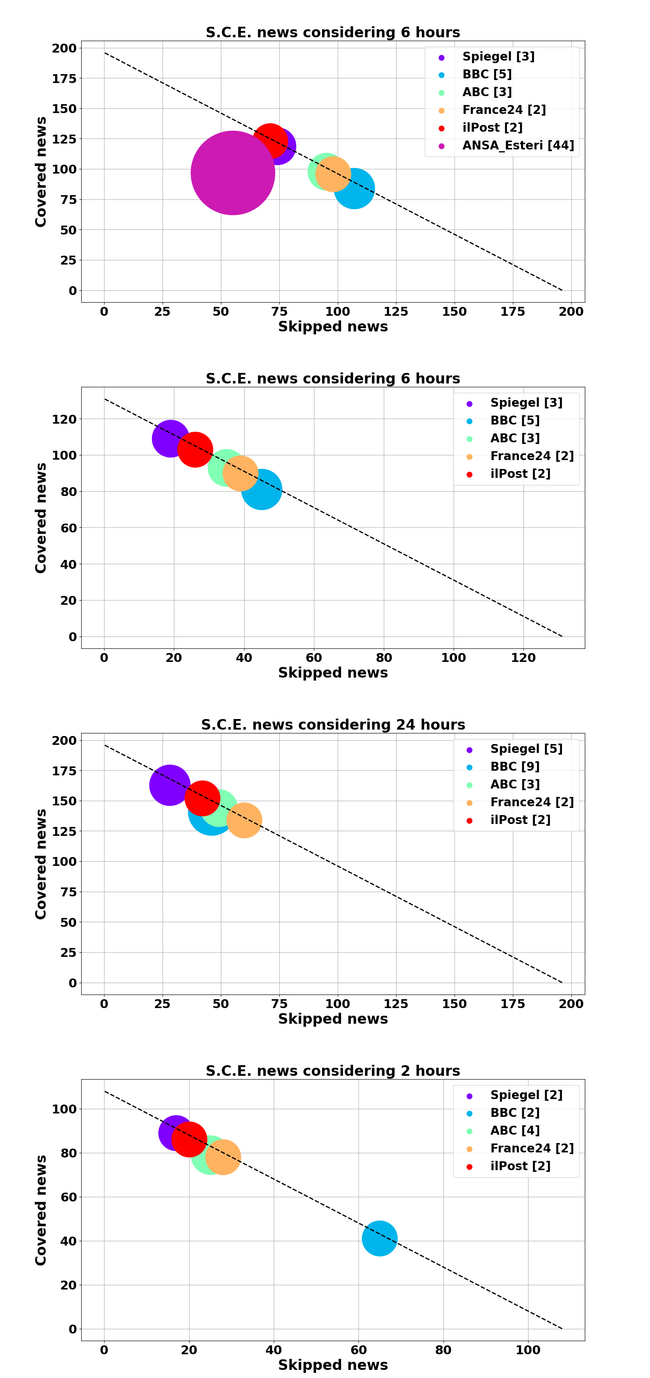
Figure 5: Commonality within an extended snapshot of 6 hours (8:00am - 2:00pm)
unchanged. This indicates that the editorial lines are consistent and each outlet tends to publish some news more than others. Again, BBC increased the overall coverage and exclusivity, showing that the activities are regular throughout the day.
Figure 6: Commonality within an extended snapshot of 24 hours (from 8:00am)
Finally, let us briefly discuss Figure 7. In this part of the experiment, we considered a 6-hours extended snapshot but also added a further outlet, the Italian News Agency ANSA. The nature of the outlet heavily affected the results. In fact ANSA publishes news items very frequently and related news are considered separately
(for instance, political reactions to a news might end up being considered distinct news in our model). Indeed the exclusivity of ANSA is very high in comparison to the other outlets. Note also that the highest coverage is now obtained by il Post and not Spiegel anymore. This is also not surprising, considering that il Post is an Italian newspaper and has a larger overlap with ANSA.
Figure 7: Commonality within an extended snapshot of 6 hours (8:00am - 2:00pm) but also considering ANSA.
6 CASE STUDY 2: NEWS CHURN
The second case study concerns the definition of news churn: the average lifespan of a piece of news [8]. This is formally defined as the number of consequent snapshots in which is possible to find articles similar to the given one. For this experiment, different sources have been chosen (Spiegel, BBC, CNN, ABC and France24) and for each of them churn rate in a given slice of time is calculated, in order to compare the tendency of each outlet, in different TOD, to have a rapid turnover of articles. It is important to point out that this phenomenon is not strictly correlated to a malevolent editorial line: it could be due to a high density of articles because of the specific day or just to a higher productivity of the outlet thanks to a large editorial team. Subsequently pseudocode for the computation of the churn rate for a given news outlet in a given time range is provided.
Algorithm 1 Calculate churn rate for an outlet
𝑝𝑒𝑟𝑖𝑜𝑑= [𝑠𝑛𝑎𝑝𝑠ℎ𝑜𝑡0,𝑠𝑛𝑎𝑝𝑠ℎ𝑜𝑡1, ...,𝑠𝑛𝑎𝑝𝑠ℎ𝑜𝑡𝑛] for 𝑠𝑛𝑎𝑝𝑠ℎ𝑜𝑡in 𝑝𝑒𝑟𝑖𝑜𝑑do
𝑛𝑒𝑤𝑠𝑝𝑖𝑒𝑐𝑒𝑠= 𝑛𝑒𝑤𝑠𝑝𝑖𝑒𝑐𝑒𝑠+ 𝑠𝑛𝑎𝑝𝑠ℎ𝑜𝑡
end for 𝑛𝑒𝑤𝑠𝑝𝑖𝑒𝑐𝑒𝑠= 𝑟𝑒𝑚𝑜𝑣𝑒𝑑𝑢𝑝𝑙𝑖𝑐𝑎𝑡𝑒𝑠(𝑛𝑒𝑤𝑠𝑝𝑖𝑒𝑐𝑒𝑠)
𝑓𝑜𝑢𝑛𝑑= {} for 𝑛𝑒𝑤𝑠𝑝𝑖𝑒𝑐𝑒in 𝑛𝑒𝑤𝑠𝑝𝑖𝑒𝑐𝑒𝑠do
for 𝑠𝑛𝑎𝑝𝑠ℎ𝑜𝑡in 𝑝𝑒𝑟𝑖𝑜𝑑do
if ℎ𝑎𝑠𝑒𝑞𝑢𝑖𝑣𝑎𝑙𝑒𝑛𝑡𝑖𝑛𝑎𝑟𝑟𝑎𝑦(𝑛𝑒𝑤𝑠𝑝𝑖𝑒𝑐𝑒,𝑠𝑛𝑎𝑝𝑠ℎ𝑜𝑡) then
𝑓𝑜𝑢𝑛𝑑[𝑛𝑒𝑤𝑠𝑝𝑖𝑒𝑐𝑒] = 𝑓𝑜𝑢𝑛𝑑[𝑛𝑒𝑤𝑠𝑝𝑖𝑒𝑐𝑒] + 1
end if
end for
end for 𝑐ℎ𝑢𝑟𝑛𝑟𝑎𝑡𝑒= 1/𝑎𝑣𝑔(𝑓𝑜𝑢𝑛𝑑)
In this case, it was considered a period of 8 hours, calculating the average churn every 2 hours for each of the outlets, starting from 2022-04-21 at 12:00. First possible analysis is a intra-outlet one: given this definition of churn rate, it is possible to look for churning trends in specific hours or dates, given an outlet. For example, we can see churning rate of ANSA’s World section during three days of March 2023, considering CET. Slices of 2 hours have been used for the rate computation.
Figure 8: ANSA’s churning rate during three days
Figure 9: ANSA’s average churning rate during three days
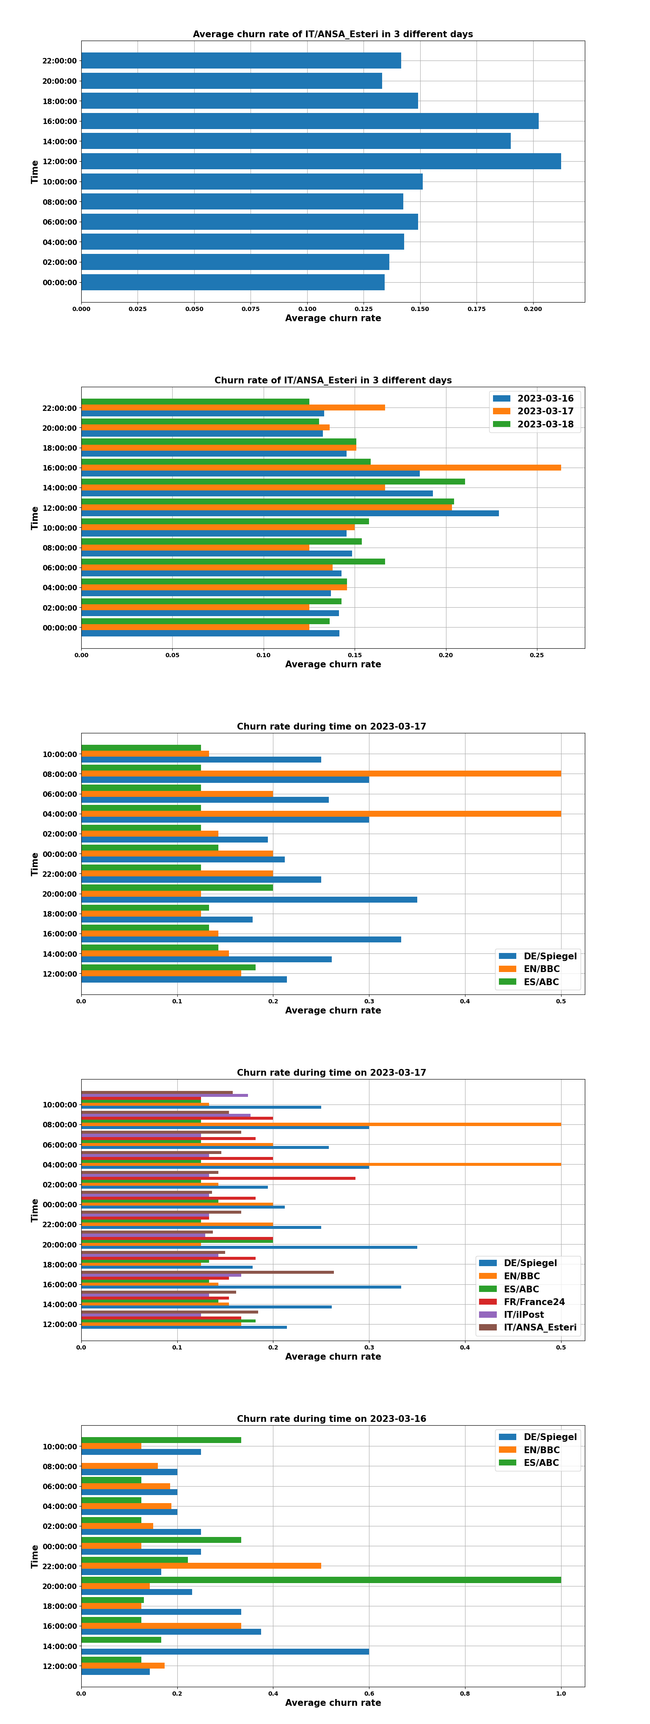
As Figure 8 shows, there is actually a trend in churning rate of the chosen outlet in different days, except for a peak at 16 of 03-17. However, a higher churning rate is visible between 12:00 and 18:00, probably because this is corresponding to working time, considering that the rate is computed in the two hours before the considered one. A second possible analysis concerning churning rate is a comparative one (inter-outlets). As before, it will be shown the changing of churning rates at different times of the day, but considering the same day and different outlets. As mentioned before, only Europeanbased newspapers have been considered, normalized on Central European Timezone, in order to compare easily the publishing rates per hour. Figure 10 pictures a regular situation, with some outlets (such as Spiegel) that tend to churn more than the others, but with a similar distribution over the day hours. In order to see more accurately few specific outlets, Figure 11 is provided. Here we can see that ABC is one of the regular churning outlets, while BBC has higher churn rates at 06:00 and 08:00.
Figure 12 shows a similar trend, but with a higher average churning rate of Spiegel and a ABC peak at 20:00. Its churning rate equals 1, which means that news pieces lasted on the publishing system for an average of a single snapshot. These charts picture a regular average situation, with a little variance between outlets, but also irregularities between days: not always they same outlets have churn peaks, it is strictly related to editorial lines and the different national impact of occurring events.
Figure 10: Churning rate of different outlets on 2023-03-17
Figure 11: Zoom on churning rate of three different outlets on 2023-03-17
Figure 12: Zoom on churning rate of three different outlets on 2023-03-16
7 DISCUSSION AND LIMITATIONS OF THE APPROACH
Even if limited to a quite small amount of data, the experiments presented in the previous sections confirmed the applicability of our approach and gave us precious indications to move our research forward. This work is in fact a first step of a larger project, whose objective is to build an extensible framework for comparison of online news and outlets. Our first goal here was to develop the foundations of the model, supported by a proof-of-concept implementation, and to verify its feasibility. The next step will be to perform larger experiments and to evaluate the results with journalists and scholars, in order to help them answer questions about journalism practices and phenomena. The framework is in fact modular by design and not tied to one single specific use case. It is intended to be a tool in the hands of experts (but also common readers) to shed light on news circulation. Undeniably there are still a lot of limitations in our approach that need to be tackled. First of all, the identification of "the same news" should be improved. Indeed, we plan to investigate more sophisticated linguistic approaches for mapping news across outlets. The language of the sources is a dimension to study more in detail. The current version of TARO works on translated news pieces, and this is a threat to the semantic validation of comparisons between articles. We are looking at libraries for the analysis of inter-lingual text, together with methods for the comparison of articles written in different languages based on NER and word embeddings. The identification of the outlets being compared is another critical issue. For our preliminary experiments, we manually selected some sources and some channels assuming they cover similar subjects. A more precise characterisation of the input news outlets would allow more accurate analyses. For instance, it would be interesting to group newspapers by continent, country, left/right political approach and to perform target studies within/across groups. The current implementation is also limited in terms of the time (extended) slots used for comparison. It would be helpful to perform similar analyses on different slices of time, for example comparing morning and evening rates, or weeks, or months, even close to specific events. Another possible approach could be the comparison between totally different sources, such as the one defined as edition and the flow ones, analyzed in this paper. A different direction we are moving is the enhancement of the software itself. The articles scraping could be widened, collecting news pieces from different websites’ sections or from more pubblication systems (e.g. Twitter or Facebook official accounts). Also, scraping could be performed more continuously, using some sort of diff files, instead of complete snapshots. Note also that the current implementation compares pairs of outlets and repeats some comparisons. More optimised approaches, based on dynamic programming paradigm, could be integrated to make the system more scalable.
8 RELATED WORK
TARO’s analyses stem from concepts and approaches being explored in the field comparative journalism. For example, our definitions of snapshots and snapshot extensions are extensions of the Regular Interval Content Capture proposed by Widholm [12]. With regard to the technical implementation of TARO, Shelar et al. showed that SpaCy performs best for linguistic analysis and Named Entity Recognition, in particular on newspaper articles, than other tools such as, for instance, Tensorflow [3]. The use of the cosine algorithm and TF-IDF for similarity calculation is inspired by similar procedures such at Automated Essay Scoring [4]. A comparison of other coefficient of similarity has been done by Thada and Jaglan [11], confirming better result for cosine formula than for Dice and Jaccard. Porrata et al. also use TF-IDF to calculate semantic similarity of news articles (pieces of news from the outlet El Pais) [9]. In the same work, Porrata el al. also describe their approach to temporal similarity, in which not only the publication date is used, but additional information is extracted from the article content. While this leads to the collection of a richer kind of temporal data, their approach would not fit our aims, since it adds complexity while not providing more insight into the newspaper editorial line. An interesting alternative approach to news modeling can be found in the works of Motta, Opdahl et al. that, in a series of articles, present the concept of news angles [6] and provide ontologies to describe them [7]. The concept of news angles nicely fits the TARO model: while news angles focus on finding and describing the perspective from which a event is narrated in an article, TARO focuses on providing computational facilities and terminology related to the the publication and to the comparison of said articles. A possible convergent path would see the re-framing of existing news angles analyses as TARO-based analyses, expanding the concept of similarity to include similarity between outlets’ angles and editorial lines.
9 CONCLUSION
In this paper we presented TARO: a model for the collection and analysis of online news. Our goal here was to define a methodological framework, to test it with some proof-of-concept implementations, and to perform a preliminary assessment of its soundness and applicability. The long-term goal is for the TARO model to act as a reference formal groundwork upon which other researchers can build their specific analysis. The TARO framework in fact provides ways to calculate various quantifiable properties of news items, that were used in two studies to quantify a discussed aspect of modern journalism: churnalism, i.e. the tendency of news outlet to publish the same news and, at the same time, to quickly discard them. In particular we measured: diffusion (how widespread a piece of news is) and persistence (how long a piece of news has been published by a news outlet). The experiments gave us clear indications about the fact that TARO can be employed to capture aspects of journalism practices. Undeniably, these experiments only involved a small number of samples - and the results per se are not the key contribution of this
work, which is instead focused on the methodological framework - but we expect that larger samples lead to more meaningful results for journalism. Indeed, the current implementation of TARO makes use of multiple comparison techniques that involve machine NLP translation, entity recognition, and similarity metrics. It is important to stress that these components are at a proof-of-concept stage of development. In particular, the identification of "the same news" (with better similarity metrics, and more accurate coverage) and the translation of the news (with more precise translators) are two key modules we are working on to strengthen TARO, so as to make it a complete toolkit in the hands of journalists, publishers, scholars and common readers.
REFERENCES
[1] Yoel Cohen. 2017. Diffusion Theories: News Diffusion. John Wiley & Sons, Ltd, Hoboken, USA, 1–11. https://doi.org/10.1002/9781118783764.wbieme0060 arXiv:https://onlinelibrary.wiley.com/doi/pdf/10.1002/9781118783764.wbieme0060
[2] Tony Harcup. 2021. Journalism: principles and practice. Sage Publications Ltd, Thousand Oaks, USA. 1–100 pages.
[3] Neha Heda Hemlata Shelar, Gagandeep Kaur and Poorva Agrawal. 2020. Named Entity Recognition Approaches and Their Comparison for Custom NER Model. Science & Technology Libraries 39(3) (2020), 324–337. https://doi.org/10.1080/ 0194262X.2020.1759479
[4] Alfirna Rizqi Lahitani, Adhistya Erna Permanasari, and Noor Akhmad Setiawan. 2016. Cosine similarity to determine similarity measure: Study case in online essay assessment. In 2016 4th International Conference on Cyber and IT Service Management. IEEE, Bandung, Indonesia, 1–6. https://doi.org/10.1109/CITSM. 2016.7577578
[5] Christopher D. Manning, Prabhakar Raghavan, and Hinrich Schütze. 2008. Introduction to information retrieval. Cambridge University Press, Cambridge, UK. https://doi.org/10.1017/CBO9780511809071
[6] Enrico Motta, Enrico Daga, Andreas L. Opdahl, and Bjørnar Tessem. 2020. Analysis and Design of Computational News Angles. IEEE Access 8 (2020), 120613– 120626. https://doi.org/10.1109/ACCESS.2020.3005513
[7] Andreas Opdahl and Bjørnar Tessem. 2021. Ontologies for finding journalistic angles. Software and Systems Modeling 20 (02 2021). https://doi.org/10.1007/ s10270-020-00801-w
[8] Gregory P. Perreault. 2022. Digital Journalism and the Facilitation of Hate (1st ed.). Routledge, London, UK. https://doi.org/10.4324/9781003284567
[9] Aurora Pons-Porrata, Rafael Berlanga-Llavori, and José Ruiz-Shulcloper. 2002. Temporal-Semantic Clustering of Newspaper Articles for Event Detection. In Pattern Recognition in Information Systems. 2nd International Workshop on Pattern Recognition in Information Systems, PRIS 2002, Ciudad Real, Spain, 104–113.
[10] David Tewksbury and Scott Althaus. 2000. Differences in Knowledge Acquisition among Readers of the Paper and Online Versions of a National Newspaper. Journalism & Mass Communication Quarterly 77 (09 2000), 457–479. https: //doi.org/10.1177/107769900007700301
[11] Vikas Thada and Vivek Jaglan. 2013. Comparison of Jaccard, Dice, Cosine Similarity Coefficient To Find Best Fitness Value for Web Retrieved Documents Using Genetic Algorithm. International Journal of Innovations in Engineering and Technology 2 (08 2013), 202–205.
[12] Andreas Widholm. 2017. Online Methodology: Analysing News Flows of Online Journalism. Westminster Papers in Communication and Culture 5(2) (2017), 81–97. https://doi.org/10.16997/wpcc.69
Do you like what you are reading? Subscribe to receive updates.
Unsubscribe anytime