
Intuitive Semantic Graph Tool for Enhanced Archive Exploration
Isabella Gagliardi (IMATI MI, CNR, Milan, Italy) · Maria Teresa Artese (IMATI MI, CNR, Milan, Italy)
Published in HT '23: 34th ACM Conference on Hypertext and Social Media · DOI: 10.1145/3603163.3609069 · License: © Copyright held by the owner/author(s).
Keywords: Bert, archives, clustering, data visualization, non-expert users, pre-trained language models, transformers
Session: Poster Session
Conference: HT '23
Abstract
The paper introduces a new method for visualizing and navigatinginformation in a cultural heritage archive in a simple and intuitiveway. The proposed approach employs pre-trained language modelsto cluster data and create semantic graphs. The creation of multi-layer maps enables deep exploration of archives with large datasets,while the ability to handle multilingual datasets makes it suitablefor archives with documents in various languages. These featurescombine to provide a user-friendly tool that can be adapted todifferent contexts and provides an overview of archive contents, toallow even non expert users to successfully query the archive.
1 Introduction
In the digital age, cultural institutions are increasingly creatingdigital archives of their collections to improve public accessibility.The ongoing pandemic has further emphasized the need for sucharchives. However, the success of digital archives depends on theirusability and ease of navigation. Users must be able to find easilyand quickly what they need without getting lost in a maze of optionsand menus.The paper is focused on semantic graphs, meant as knowledgegraphs constructed based on the semantic similarity of graph nodes.Much research is related to the use of linked open data and on-tologies for KG creation. In [10] authors focus on research relatedto knowledge graph creation and publication within the Seman-tic Web domain. Arco [4] allows the construction of knowledgegraphs based on LOD. To the best of our knowledge, this is one of
Maria Teresa Arteseartese@mi.imati.cnr.it IMATI MICNRMilan, Italy
the first experiments to create semantic graphs using pre-trainedtransformer-based language models.The paper presents a pipeline for the unsupervised creation ofmultilayer semantic graphs using pre-trained language models tocluster data and create semantic graphs, which are graphical rep-resentations of words and their relationships. These graphs canbe thought of as hypertext where each node is linked to relateditems, allowing for easy navigation and exploration of archive con-tents. The approach integrates several state-of-the-art tools andmodels, such as pre-trained language models based on transformerarchitecture, UMAP for dimension reduction, and HDBSCAN forclustering, to create an intuitive and adaptable tool suitable for avariety of contexts. The defining characteristics of this approach areits unsupervised nature and its ability to create multi-layer graphs.It is also capable of handling multilingual datasets, as demonstratedby its successful testing on a portal for managing intangible culturalheritage data in multiple languages [2, 3].
2 The Approach
In the poster, we will present an innovative way of presenting thecontents of an archive, as a multilevel graph. Each node of thetop-level graph represents one or more sets of elements, groupedthrough clustering algorithms. The lowest level graphs are 1 to1 with the documents in the archive. If necessary, the clusteringstep is iterated, creating intermediate graphs, until the numberof nodes in each graph is below a certain threshold. Clusteringis performed on vectorized elements, using pre-trained languagemodels based on neural networks and later fine-tuned. In case thelevel of graphs is higher than two, it is necessary to create onevector for all its underlying elements. Several ways of combininghave been investigated, described in more details in the poster.The pipeline depicted in Figure 1 includes several steps, startingwith a standard preprocessing stage that also extracts candidatewords [8, 9] to describe the essential content of the item, as anadditional way of processing the data:Clustering: BERT and other transformers models [5, 11] havebeen used (and tuned) to transform text data into high-dimensionalvectors that capture semantic meaning. We then apply UMAP [7]to the vectors to obtain a lower-dimensional space that is the inputto HDBSCAN [6] for clustering similar texts. This approach hasbeen shown to be very effective in this context. Several tests havebeen performed to evaluate the best parameter values of UMAP and HDBSCAN and pre-trained language models, e.g., BERT, Ro BERTaand ALBERT [1]. Clustering is iterated until the number of elementsis below a certain threshold, identified as 30, with the essentialcontribution of target users and domain experts.
different values of the hyperparameters for clustering and pre-trained models on both monolingual Italian /English /French/ German and mixed datasets. In the presented experiments, textual metadata from an intangible cultural heritage inventory was utilized. This metadata includes titles, keywords, and words extracted from the descriptions. Typically, the data used is in either Italian or English. However, if data in the desired language is not available, the existing metadata is utilized. Since low-level graphs are pointers to archive documents, datasets created from different metadata were separately tested. Qualitative results have demonstrated the effectiveness of the pipeline in generating meaningful semantic graphs and exploring different visualization techniques that can be used to communicate the relationships between data to experts and users. We collected feedback from experts in (intangible) heritage and web users, which indicated that the simplicity and usability of the graph visualization were highly appreciated. They have highlighted that graphs with a number of nodes greater than 30 make understanding and navigating the graph difficult. We also discovered that low-level clusters included unrelated elements or that some related elements were scattered across multiple clusters when there were either too few or too many clusters. These issues need to be addressed in order to enhance the visualization. Future activities will focus on quantitative evaluation of the results, tools to suggest to users how to traverse the graphs and integration of fish-eye views to overcome the problem of overly dense graphs. Additional materials can be accessed at
https://arm.mi.imati.cnr.it/papers/ht2023.
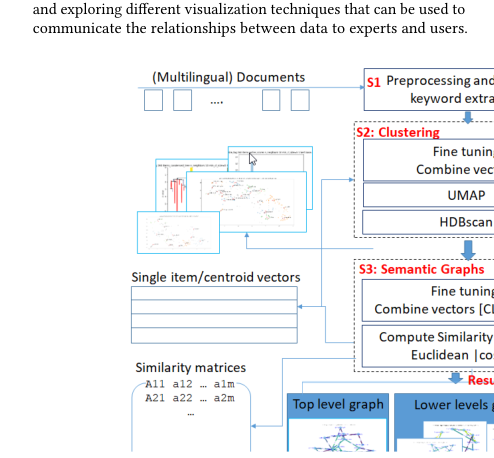
Figure 1: The pipeline for the unsupervised creation of multilayer semantic graphs
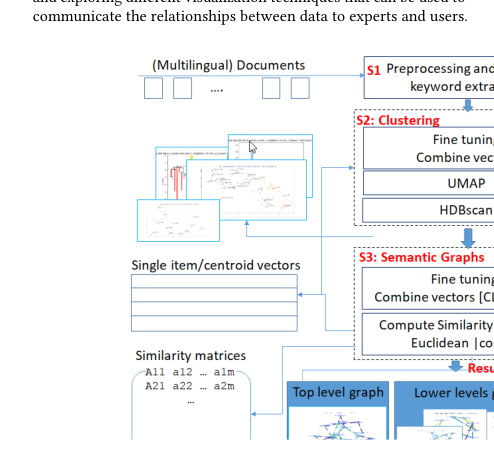
Figure 1: The pipeline for the unsupervised creation of multilayer semantic graphs.
Semantic graphs: The first step is the creation of the similaritymatrices. To create these matrices, we used pre-trained transform-ers: each element, corresponding to a centroid or a document, isrepresented by a single vector, obtained by preprocessing the inputtext and inserting it into the transform model. To represent a docu-ment, [CLS] or [AVG] tokens are used, while for the centroid, inthis experiment, the averaged [CLS] tokens from the lower-leveldocuments were used. These tokens are compared pairwise using adistance metric like cosine similarity to create the similarity matrix.A qualitative evaluation has been performed at this prototype stage,focused on two aspects: 1) whether the clustering and similaritymatrices could identify significant elements and 2) whether usersfound browsing the archive via graph intuitive, useful and helpful.An initial qualitative assessment yielded a positive response forboth aspects.
texts. This approach has been shown to be very effective in this context. Several tests have been performed to evaluate the best parameter values of UMAP and HDBSCAN and pre-trained language models, e.g., BERT, Ro BERTa and ALBERT [5]. Clustering is iterated until the number of elements is below a certain threshold, identified as 30, with the essential contribution of target users and domain experts.
Semantic graphs: The first step is the creation of the
similarity matrices. To create these matrices, we used pre-trained transformers: each element, corresponding to a centroid or a document, is represented by a single vector, obtained by preprocessing the input text and inserting it into the transform model. To represent a document, [CLS] or [AVG] tokens are used, while for the centroid, in this experiment, the averaged [CLS] tokens from the lower-level documents were used. These tokens are compared pairwise using a distance metric like cosine similarity to create the similarity matrix. A qualitative evaluation has been performed at this prototype stage, focused on two aspects: 1) whether the clustering and similarity matrices could identify significant elements and 2) whether users found browsing the archive via graph intuitive, useful and helpful. An initial qualitative assessment yielded a positive response for both aspects.
3 Results and Conclusions
The goal of this experiment has been to create a way to visualize theentire contents of an archive through graphs of increasing detail.The poster will report the results of the experiments testing differ-ent values of the hyperparameters for clustering and pre-trainedmodels on both monolingual Italian /English /French/ German andmixed datasets. In the presented experiments, textual metadatafrom an intangible cultural heritage inventory was utilized. Thismetadata includes titles, keywords, and words extracted from thedescriptions. Typically, the data used is in either Italian or English.However, if data in the desired language is not available, the ex-isting metadata is utilized. Since low-level graphs are pointers toarchive documents, datasets created from different metadata wereseparately tested. Qualitative results have demonstrated the effec-tiveness of the pipeline in generating meaningful semantic graphsand exploring different visualization techniques that can be used tocommunicate the relationships between data to experts and users.
The goal of this experiment has been to create a way to visualize the entire contents of an archive through graphs of increasing detail. The poster will report the results of the experiments testing
We collected feedback from experts in (intangible) heritage and webusers, which indicated that the simplicity and usability of the graphvisualization were highly appreciated. They have highlighted thatgraphs with a number of nodes greater than 30 make understandingand navigating the graph difficult. We also discovered that low-levelclusters included unrelated elements or that some related elementswere scattered across multiple clusters when there were either toofew or too many clusters. These issues need to be addressed inorder to enhance the visualization. Future activities will focus onquantitative evaluation of the results, tools to suggest to users howto traverse the graphs and integration of fish-eye views to overcomethe problem of overly dense graphs. Additional materials can beaccessed at https://arm.mi.imati.cnr.it/papers/ht2023.
References
[1] [n. d.]. Hugging face models. Retrieved 2023-03-29 from https://huggingface.co/models
[2] Maria Teresa Artese and Isabella Gagliardi. 2020. Language independent search-ing tools for cultural heritage on the Query Lab platform. In Euro-Mediterranean Conference. Springer, 657–665.
[3] Maria Teresa Artese and Isabella Gagliardi. 2022. Integrating, Indexing and Querying the Tangible and Intangible Cultural Heritage Available Online: The Query Lab Portal. Information 13, 5 (2022), 260.
[4] Valentina Anita Carriero, Aldo Gangemi, Maria Letizia Mancinelli, Ludovica Marinucci, Andrea Giovanni Nuzzolese, Valentina Presutti, and Chiara Veninata.2019. Ar Co: The Italian cultural heritage knowledge graph. In The Semantic Web–ISWC 2019: 18th International Semantic Web Conference, Auckland, New Zealand, October 26–30, 2019, Proceedings, Part II 18. Springer, 36–52.
[5] Jacob Devlin, Ming-Wei Chang, Kenton Lee, and Kristina Toutanova. 2018. Bert:Pre-training of deep bidirectional transformers for language understanding. ar Xivpreprint ar Xiv:1810.04805 (2018).
[6] Leland Mc Innes, John Healy, and Steve Astels. 2017. hdbscan: Hierarchical densitybased clustering. J. Open Source Softw. 2, 11 (2017), 205.
[7] Leland Mc Innes, John Healy, and James Melville. 2018. Umap: Uniform man-ifold approximation and projection for dimension reduction. ar Xiv preprintar Xiv:1802.03426 (2018).
[8] Rada Mihalcea and Paul Tarau. 2004. Textrank: Bringing order into text. In Pro-ceedings of the 2004 conference on empirical methods in natural language processing.404–411.
[9] Stuart Rose, Dave Engel, Nick Cramer, and Wendy Cowley. 2010. Automatickeyword extraction from individual documents. Text mining: applications andtheory (2010), 1–20.
[10] Vetle Ryen, Ahmet Soylu, and Dumitru Roman. 2022. Building semantic knowl-edge graphs from (semi-) structured data: a review. Future Internet 14, 5 (2022),129.
[11] Thomas Wolf, Lysandre Debut, Victor Sanh, Julien Chaumond, Clement Delangue,Anthony Moi, Pierric Cistac, Tim Rault, Rémi Louf, Morgan Funtowicz, et al.2020. Transformers: State-of-the-art natural language processing. In Proceedingsof the 2020 conference on empirical methods in natural language processing: systemdemonstrations. 38–45.
Do you like what you are reading? Subscribe to receive updates.
Unsubscribe anytime