
From Trolling to Cyberbullying: Using Machine Learning and Network Analysis to Study Anti-Social Behavior on Social Media
Authors: Anatoliy Gruzd, Philip Mai, Felipe Bonow Soares
Published in HT '23: 34th ACM Conference on Hypertext and Social Media · DOI: 10.1145/3603163.3610531 · License: © Copyright held by the owner/author(s).
Abstract
The rise of social media and other web and mobile applications has transformed how people interact, but it has also created new challenges, such as anti-social behavior like trolling, cyberbullying, and hate speech. This behavior can have severe negative consequences for individuals and communities. This tutorial is intended for researchers and practitioners interested in computational social science and provides an overview of how to use machine learning and social network analysis techniques to detect and examine anti-social behavior in online discourse.
Ccs Concepts
• Computing methodologies → Machine learning; • Information systems → Social networks; Internet communications tools.
Keywords
anti-social, online discourse, toxicity analysis, social network analysis, trolling, cyberbullying, computational social science
ACM Reference Format
Anatoliy Gruzd, Philip Mai, and Felipe Bonow Soares. 2023. From Trolling to Cyberbullying: Using Machine Learning and Network Analysis to Study Anti-Social Behavior on Social Media. In 34th ACM Conference on Hypertext and Social Media (HT ’23), September 4–8, 2023, Rome, Italy. ACM, New York, NY, USA, 2 pages. https://doi.org/10.1145/3603163.3610531
1 Introduction
The rise of social media and other web and mobile applications has transformed how people interact, but it has also created new challenges, such as anti-social behavior like trolling, cyberbullying, and hate speech. This behavior can have severe negative consequences for individuals and communities. This tutorial provides an overview of how to use machine learning and social network analysis techniques to detect and examine anti-social behavior in online discourse. It is designed for researchers and practitioners who are interested in learning about computational approaches to identifying and examining toxic interactions in digital spaces. The interdisciplinary nature of this research topic makes it relevant to
participants from a wide range of fields, including Computational Social Science, Information Systems, Communication, Data Science, Education, Psychology, and Sociology. The primary tool to be used during the tutorial is Communalytic [5, 6], a research tool for studying online communities and online discourse. The tool runs within a web browser and is available at communalytic.org. It can collect and analyze publicly available data from various social media platforms including Reddit, Telegram, YouTube, Twitter, and Facebook/Instagram (via CrowdTangle). Communalytic leverages advanced techniques from text analysis (e.g., topic modeling, sentiment and toxicity analysis) and social network analysis to automatically identify anti-social interactions, pinpoint influencers, map shared interests, track the spread of misinformation, and detect potential coordination among seemingly unrelated actors.
2 Method
The tutorial consists of three parts: Toxicity Analysis, “Signed” Network Analysis, Hands-on Exercise with Communalytic.
2.1 Toxicity Analysis
Part one will provide an overview of toxicity analysis, a technique that uses machine learning algorithms to detect toxic interactions in digital spaces. Participants will learn about toxicity analysis and its limitations when analyzing text-based communication. To perform this type of analysis, we will use the Toxicity Analysis module[3] in Communalytic which is built around two AI models, namely, Detoxify[10] and Google’s Perspective API[7]. Detoxify supports text analysis exclusively in English, French, Spanish, Italian, Portuguese, Turkish, and Russian; while Perspective API not only supports these aforementioned languages (except Turkish), but can also analyze posts in Arabic, Chinese, Czech, Dutch, German, Hindi, Hinglish, Indonesian, Japanese, Korean, Polish, and Swedish. Communalytic automatically identifies the language of each post and skips posts that are not in one of the supported languages. Before conducting the analysis, Communalytic also excludes specific elements such as @usernames, #hashtags, $cashtags, and URLs to reduce the possibility of biased results in case profane keywords appear within these elements. After analyzing posts within a dataset, the module generates the following scores (ranging from 0 to 1): Toxicity, Severe Toxicity, Identity Attack, Insult, Profanity, and Threat[4]. The resulting scores are visualized to facilitate data exploration. Figure 1 shows two sample visualizations produced by this module. The left chart illustrates the changes in the average values of different toxicity scores over time, relative to the overall volume of daily posts in
a given dataset. The right chart displays the overall distribution of the toxicity scores. The underlying data behind these and other charts produced by Communalytic can be exported and explored using third-party data visualization tools like Plotly[8]. Alternatively, users can download the full dataset with toxicity scores as a CSV file for analysis via a data science tool of their choice.

Figure 1: Communalytic’s Toxicity Analysis Visualizations.
2.2 “Signed” Network Analysis
Part two will introduce the basics of Social Network Analysis (SNA), a technique used to analyze the connections between users in a network. In addition, participants will learn how to construct and analyze a “signed” communication network[9] using the results of the toxicity analysis. In this network, positive and negative weights (or signs) are assigned to each connection, indicating the positive or negative nature of the interaction between a pair of users. To conduct this type of analysis, we will use the Network Analysis module[2] in Communalytic. First, this module generates a communication network (e.g., "Who Replies To Whom"). Next, it adds toxicity scores as weights to the edges within this network. Edges with scores closer to 1 are considered "negative" edges, because they are more likely to represent potentially toxic interactions that require further analysis. Figure 2 shows a network visualization in Communalytic depicting how @ChapmansCanada, a Twitter account of a Canadian ice cream brand was attacked by anti-vaxxers who made false allegations about the company’s practices and spread misinformation about their products[1]. In response, the company tweeted that they did not discriminate against unvaccinated employees but rather implemented rapid testing to ensure safety. Per the visualization, the “Min Toxicity” filter was used to hide interactions (edges) with toxicity scores below a designated threshold (in this case, we set it to 70 out of 100, or 0.7 out of 1). This facilitated the identification of accounts responsible for more toxic interactions within the network, as well as those who received toxic messages from others.
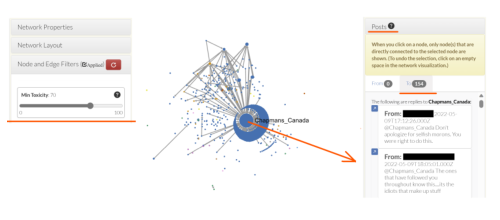
Figure 2: Communalytic’s Interactive Network Visualization.
2.3 Hands-on Exercise with Communalytic
The last part of the tutorial provides participants with practical experience in analyzing anti-social behavior in online discourse using machine learning and social network analysis. Participants will work with sample datasets from social media, perform a toxicity analysis, construct and analyze a "signed" communication network using toxicity scores, and identify key players in the network who exhibit a tendency to express or receive toxic messages.
3 Conclusion
The spread of anti-social behaviors such as trolling, cyberbullying, and hate speech has become a major concern, with significant impacts on the individuals and communities involved. Understanding how to identify and analyze these behaviors in public discourse is essential for designing and improving hypertext systems that foster positive and constructive online interactions. By the end of the tutorial, participants will be able to:
• Understand the basics of toxicity analysis and social network analysis;
• Learn how to import an existing dataset or gather new data from social media platforms like Reddit and Telegram using Communalytic;
• Identify key players in online networks who are more likely to engage in anti-social behavior.
ACKNOWLEDGMENTS
This research was funded in part by the Social Sciences and Humanities Research Council of Canada (PI:Gruzd; CoPIs:Jacobson, Hodson). Earlier versions of the tutorial were presented at the 2022 International Conference on Social Media and Society (#SMSociety) and the 2023 International AAAI Conference on Web and Social Media (ICWSM).
References
[1] Colin Butler. 2022. How even ice cream becomes political in the age of misinformation. CBC News (11 May 2022). https://www.cbc.ca/news/canada/london/ chapmans-ice-cream-1.6447871
[2] Communalytic. 2023. How to Use Communalytic’s Built-in Network Visualizer. https://communalytic.org/tutorials/tutorial-network-visualizer-incommunalytic/. Online tutorial.
[3] Communalytic. 2023. Toxicity Analysis Module. https://communalytic.org/ tutorials/tutorial-toxicity-analysis/. Online tutorial.
[4] Anatoliy Gruzd and Shahnawaz Attarwala. 2021. Toxicity Analysis of a Twitter Thread: The Case of President Trump’s Tweet about Contracting the Novel Coronavirus. https://communalytic.org/2021/01/13/toxicity-analysis-of-a-twitterthread/. Blog post.
[5] Anatoliy Gruzd and Philip Mai. 2023. Communalytic: A Research Tool For Studying Online Communities and Online Discourse. https://Communalytic.org.
[6] Anatoliy Gruzd, Philip Mai, and Zahra Vahedi. 2022. Studying Anti-Social Behaviour on Reddit with Communalytic. In The SAGE handbook of social media research methods, Anabel Quan-Haase and Luke Sloan (Eds.). SAGE Publications, 503–520. https://doi.org/10.4135/9781529782943.n36
[7] Google Inc. n.d.. Google Perspective API Documentation. https://developers. perspectiveapi.com/. Accessed: July 24, 2023.
[8] Plotly Technologies Inc. n.d.. Plotly. https://plotly.com/. Accessed: July 24, 2023.
[9] Jure Leskovec, Daniel Huttenlocher, and Jon Kleinberg. 2010. Signed Networks in Social Media. In Proceedings of the SIGCHI Conference on Human Factors in Computing Systems (Atlanta, Georgia, USA) (CHI ’10). Association for Computing Machinery, New York, NY, USA, 1361–1370. https://doi.org/10.1145/1753326. 1753532
[10] Unitary Ltd. n.d.. Detoxify: An Open-Source Python Library for Toxicity Detection. https://github.com/unitaryai/detoxify. Accessed: July 24, 2023.
Do you like what you are reading? Subscribe to receive updates.
Unsubscribe anytime