
Bridging the Analytics Gap: Optimizing Content Performance using Actionable Knowledge Discovery
Tom Alby (thomas.alby@hu-berlin.de) — Humboldt-Universität zu Berlin, Berlin, Germany
Published in HT '24: 35th ACM Conference on Hypertext and Social Media · DOI: 10.1145/3648188.3675121 · License: CC BY 4.0
Authors: Tom Alby
Keywords: actionable knowledge discovery, content curation, data mining, digital analytics, web analytics
Session: Explorations
Pages: 185–192
Conference: HT'24
Abstract
Web analytics tools like Google Analytics are widely available, but website owners outside the eCommerce sector struggle to extract actionable insights from their data to curate and optimize content. This difficulty often arises from challenges in identifying and aligning objectives with standard website performance metrics provided by these tools, compounded by a lack of expertise in tool configuration. This study focuses on automated approaches that generate actionable insights for owners of content-driven websites, analyzing visitor attention at the most granular level by focusing on segments of web pages. It considers both the length of the page and different device types used to access these pages.
Existing research is augmented with four major contributions: First, a robust regression model to predict user behaviour based on the scroll behaviour of 850,000 visitors and more than 9 million data points from five diverse websites. Second, a dataset of measurements of web page lengths from a random sample of one million websites, for a better understanding of the relation between scroll behaviour and web page lengths. Third, an actionable knowledge discovery method for web analytics data of non-transactional websites that allows to identify deviations from expected visitor behaviour, enabling content optimization for those web analytics users who find it difficult to leverage their data today. Finally, an indicator for page performance that allows to compare page performance based on in-page visitor engagement. This research exemplifies the intersection of web analytics and intelligent content curation, showcasing a methodological framework that facilitates the generation of automated suggestions for digital content optimization, rooted in comprehensive behavioral data analysis.
CCS Concepts: • Information systems → Traffic analysis; Data analytics; • Applied computing → Document preparation.
Keywords: content curation, web analytics, digital analytics, actionable knowledge discovery, data mining
ACM Reference Format:
Tom Alby. 2024. Bridging the Analytics Gap: Optimizing Content Performance using Actionable Knowledge Discovery. In 35th ACM Conference on Hypertext and Social Media (HT '24), September 10–13, 2024, Poznan, Poland. ACM, New York, NY, USA, 8 pages. https://doi.org/10.1145/3648188.3675121
1 Introduction
While transactional websites such as eCommerce shops have monetary goals that are straightforward to track, tools like Google Analytics (GA), primarily designed with transactional sites and marketing needs in mind, do not cater effectively to the specific requirements of non-transactional websites [10, 37]. This leads to difficulties for owners of such sites in utilizing web analytics data [33], especially if they do not adapt these tools to their context [10]. Additionally, the interpretation of web analytics data is hindered by challenges in defining website goals for content-driven sites, which complicates the extraction of actionable insights [1]. As a consequence, although Google Analytics is used on more than 50% of all web pages [41], only a small proportion of these websites feature advanced analytics implementations that are capable of yielding meaningful insights [2].
Non-transactional website owners struggle to interpret standard key performance indicators (KPIs) such as page views, bounce rate, and time spent on site due to their ambiguous nature [37]. For instance, a low number of page views might signal niche content rather than poor search visibility, and a high bounce rate could either mean that visitors quickly found what they needed or that they regarded the content as irrelevant. Moreover, standard implementations of most web analytics tools inaccurately track time on a site by omitting time spent on the last page visited, leading to wrong conclusions. But even if the correct time spent on each page was available, how exactly would that help to optimize content? Despite GA4's launch in 2023, which introduced better interaction tracking [21], it also requires additional setup and expertise.
No matter what web analytics software or version is used, by adapting the tracking code and going further than the standard metric of a page view, it is possible to offer insights into visitor behavior within a page, for example to identify where visitors lose interest or scroll slower. Unfortunately, such code adaptations are rare [2]. Advanced tools like Crazy Egg and HotJar, offering heatmaps and visitor behavior recordings, bridge this gap yet are minimally adopted (3.1% for HotJar and 0.4% for Crazy Egg as of December 2023 [40]). Furthermore, a heatmap marks the analysis' start, not its conclusion, leading to questions about pattern applicability across the site and the definition of expected behavior.
This research makes key contributions by analyzing over 10 million scroll depth data points from five websites, providing the first comprehensive page length overview from over one million websites to define short, average, and long pages, introducing a page performance indicator, and developing an automated action discovery approach for non-transactional websites using a model that accounts for page length and device type. The paper is structured as follows: Section 2 reviews related work, Section 3 outlines the data collection and processing methodology, Section 4 discusses model development and insights, and Section 5 concludes with findings and future research directions.
2 Related Work
The Web Analytics Association, rebranded to Digital Analytics Association in 2012 and dissolved in 2024, provided a widely used definition of web analytics as the measurement, collection, analysis, and reporting of Internet data for the purposes of understanding and optimizing Web usage [42]. While measurement and collection are done by web analytics tools such as Google Analytics, this does not mean that the data is actually being used effectively. The Web Analytics Association found that the main concern for analytics tool users is how to use the data effectively, especially for making business decisions [44]. [37] and [33] highlighted that while web analytics tools are widely available, their effective use, especially in non-transactional websites, remains limited and is often driven by curiosity or entertainment rather than strategic decision-making. [10] as well as [37] attributed this shortcoming to Google Analytics' design for marketing and eCommerce. For non-transactional websites, while event tags on texts could track reader engagement, such data is not collected automatically and thus requires a customization. [8]'s study showed that while many businesses adopt web analytics tools, they do not use them much. The difficulty to create business value has been a topic of several studies as well [17, 18, 47].
The use of Google Analytics in various contexts has been extensively researched [5, 11, 12, 15, 16, 28–30, 30–32, 34, 36, 45, 48], yet in all of these cases, only a standard installation was employed. Examples of research that leveraged advanced GA features, on the other hand, are rare. [13] explored the use of click analytics tools such as Google Analytics' In-Page Analytics (a feature that was present in the early days of Google Analytics) and Crazy Egg in redesigning a library homepage, emphasizing their role in tracking user interactions and aiding in website improvements. [39] focussed on tracking user behaviour on an academic library website by utilizing Google Analytics events. Similarly, [6] introduced a method called Pixel Efficiency Analysis (PEA) for academic library websites, measuring screen real estate in pixels against organizational goals and user interactions.
Advanced tracking of user behaviour has also been taking place outside the Google Analytics realm. [20]'s study investigated the use of document display time as implicit feedback in online searches, finding no consistent correlation between display time and document usefulness, with significant variations based on task and individual user differences. [27] used logfiles from a web browser plugin to create a model of dwell time, the time a user spends on a specific webpage before going back to search results or finishing the current task, identifying document length as a key feature for the model. Dwell time, however, correlates only to some extent with page length [46], and given that users may open several browser tabs and get interrupted in their work, it is questionable if dwell time alone is a robust signal [26].
Analyzing user attention to page segments has been suggested by several authors [10, 25]; this is not only limited to scroll data but also includes text selection heatmaps [22, 23] and Copy to Clipboard heatmaps [24]. [7] showed that segment-level display (aka scroll viewport data) may be as valuable as eye tracking data. Utilizing data from 1.2 million news reading sessions, [14]'s study developed advanced models to measure user engagement through in-page scrolling and viewport time, providing insights into user attention at a granular level previously attainable only via eye-tracking studies.
Turning data into actionable insights has been a challenge not only in web analytics. [19] stressed that data mining methods often focus on finding several patterns, neglecting the usability of the patterns extracted from the data. [4] argued that only a knowledgeable agent with expectations, that is, goals, can derive information from data, but both knowledge and goals are often missing in web analytics as mentioned above. This is obviously an opportunity for Actionable Knowledge Discovery (AKD) methods to fill the gap, but they are elusive in the domain of web analytics. [26], for example, developed a probabilistic model named TUNE to better understand and predict user engagement with online news articles. Similarly, [43] addressed the challenge of predicting the viewability of display ads on webpages, considering factors like page depth and user dwell time. Actionability can also be created by advanced visualizations [38].
In the realm of web analytics for content curation and creation, the literature has predominantly focused on quantitative metrics that often fail to translate directly into actionable insights for non-transactional websites. Also, there remains a notable gap in the development of actionable knowledge discovery methods, particularly those tailored to the primary users of web analytics who currently struggle to leverage their data effectively. This research seeks to bridge this gap by developing and implementing models based on in-page visitor behaviour data that can be collected by standard tools without bespoke technical setups.
3 Methodology
3.1 Data Collection
The community edition 4.1x of Matomo, an open source web analytics tool that adheres to GDPR [35], was utilized for collecting user behavior data from five diverse websites. Updates from Matomo version 4.12.3 to 4.16 during the study did not affect data coherence. Matomo by default does not track scroll depths; hence, additional events for measuring scroll depths at 10% intervals of page length were set up via tag managers like Google and Matomo. Tag managers, using JavaScript, track user interactions and trigger tags to send data to tracking servers when specific conditions are met.
Recruitment of websites for this research project was facilitated by web analytics consultants from Austria and Germany that participated in a previous study [1]. Many interested sites lacked sufficient traffic (minimum 1,000 visitors per month) while sites that surpassed that threshold, required extensive discussions with data protection officers, despite Matomo's privacy compliance. The final five participant websites, though not representative of the web, provide diverse thematic insights, especially because they include a transactional website as well, providing an opportunity to observe differences in comparison to non-transactional sites.
Data from the websites has been collected since late 2022 and early 2023 respectively until December 22nd, 2023:
A personal blog, mainly in German, with 26,385 visitors within the experiment timeframe, 90.05% coming from the DACH region (Germany, Austria, and Switzerland), followed by the United States (2.65%), Spain (0.52%) and other countries, based on Matomo measurements.
A dermatology practice website, completely in German with 21,832 visits, 97.15% of all visitors coming from the DACH region.
A web analytics blog with 51,489 visits, 92.56% coming from the DACH region, followed by the United States (2.79%), the Netherlands (0.45%), and other countries.
An eCommerce store of a retailer in German and English with 706,428 visitors, 86.30% coming from the DACH region, followed by the United States (2.10%), the Netherlands (1.36%), and other countries.
An international project management information website in English with 194,314 visitors, primarily from the United States (24.21%), India (8.45%), China (7.2%), and many other countries.
The number assigned to each site will be used in the following when differences between sites are described. More than 24 million data points were collected from these sites before cleaning.
In order to get the height of each page, height being used as a synonym for page length, an automated virtual browser with a window resolution of 1,200 x 800 pixels was used to create a screenshot and take a measurement. Predefining the height of the virtual browser window as 800 pixels, however, resulted in all websites with a smaller height to be subsumed with this height. Another challenge that is related to this limitation is the fact that different device types will differ in length of viewports and page length, so that length data had to be transformed as described in the next section. While a 20% scroll depth threshold is theoretically the same content-wise, in reality, responsive design approaches may alter pages. This is being taken care of during data transformation.
Finally, the virtual browser mentioned above was also used to get an overview of web pages' height on a general level. After reviewing the height distribution of the five sites, site 3's distribution looked very different from the rest. As a consequence, the decision was made to take a large sample of web pages in order to understand the extent to which site 3 differs from a representative sample. One million web pages were crawled with a multi-threaded version of the virtual browser, using a random sample from the Common Crawl host-level graph [3]. While only homepages were crawled and their lengths may not represent those of other pages on a website, these gateways to a website often present key structural and navigational elements that are indicative of a website's overall design and organization. The code for the Python crawler is available on GitHub.[^1]
[^1]: https://github.com/daswesen/BridgingAnalyticsGap
It is important to acknowledge the potential biases inherent in the data. These biases could arise from factors such as demographic variations across the visitor base of different websites, the specific design and content structure of each site, or the particular nature of non-transactional versus transactional content. Such factors might uniquely influence engagement metrics and the performance of different behavioural models. Having said that, most of the existing research has been focused on creating models for a single site [13, 24, 26], whereas the approach in this paper allows to compare models between different sites.
3.2 Data Processing
Data collected from the websites was fetched from the Matomo server every night during the experiment using the Matomo API's Live.getLastVisitsDetails call, and then processed to be written into a database to accelerate data retrieval. While Matomo collects a wide range of variables, only those relevant for analysis were selected for further processing. For instance, browser versions and installed plugins were removed. A complete list of the variables used, an anonymized sample of the data as well as the R software to process this data is available for download.[^2]
[^2]: https://alby.link/akddata
In a second step, data was cleaned and transformed. Only desktop, tablet, and smartphone requests were considered; phablets, a term used for big smartphones, were regarded as smartphone devices. Device types that rarely occurred, such as portable media players, TV, or consoles, were removed. After this step, 99.82% of all data points were still available. Furthermore, pages that displayed error messages or were generated dynamically with a new URL but without any difference to existing pages, were also removed. In addition, only scroll movements from the top to the bottom of a page were included. After this step, 47.32% of the initial data was left (still more than 10 million data points). In addition, only pages that were viewed at least 30 times, taking either the full site or device segmentation into account, were considered. 1,880 out of 5,625 pages remained after applying this filter which still results in 36.8% of the initial data. This threshold was validated in the correlation analysis.
Percentage data from scroll depths was converted to device-specific height data based on the measurements taken by the automated virtual browser, as described in the previous section. Browser window sizes are not collected by Google Analytics or Matomo with built-in means, and while for each visitor, individual screen resolution data was available, the browser window size is most likely not the same as the screen resolution [9]. Instead, using the screen resolution data collected in Matomo, median screen sizes were computed for each device type, and, given the low variance for each device type, viewport heights of 1,067, 844, and 1024 pixels for Desktop, Smartphone, and Tablet respectively were defined. In addition, browsers usually come with interface elements that further reduce the space that is used to display a website. This is reflected by using 95% of the Desktop height and 90% of the Smartphone and Tablet height, based on measurements on different devices. Finally, for each page of each website, the percentage of visitors at each scroll depth, later called retention, is computed, segmented by device types. This data was used for fitting the models.
4 Analysis and Results
4.1 Descriptive Analysis
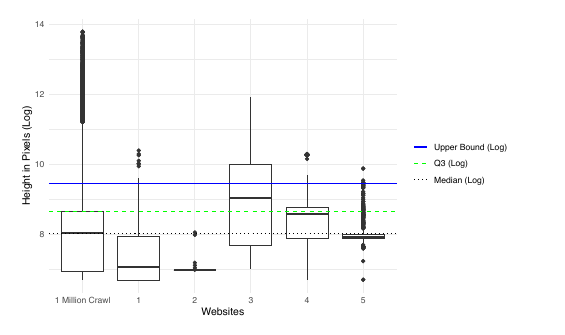
Figure 1: Boxplot of page height distribution of the one million site crawl and the experiment sites with logarithmized length values.
The medium web page height measured in the one million website crawl is 3,082 pixels, the mean is 5,161 pixels, indicating a skewed distribution. The minimum of 800 pixels was defined by the virtual browser settings, the maximum height of a website was at 987,966 pixels (a blog without pagination). The distribution is shown as the 1 Million Crawl boxplot in Figure 1, using a logarithmic scale for the pixel length.
The height crawl was also done for the sites in the experiment, showing a different distribution for each site as displayed in Figure 1 as well. Except for site 3, the IQR of all sites is below the upper bound of the boxplots, with site 2 and 5 showing a narrow IQR and site 2 exhibiting very few outliers. Site 1 and 2 have a median significantly below the median of the one million website crawl, site 5's median is close to the overall website height median, and sites 3 and 4 are above the median. Given the median browser window height, very short pages would be mostly visible in one viewport without scrolling on most screens, whereas an average page would go through 3-4 viewports.
As site 3 mainly contains longer pages and site 2 mostly shorter ones (which could have an impact on model fitting), page lengths were categorized with regard to their position in the distribution for a potential use in modeling. The first category for very short pages goes from 800 pixels to the 1st quartile (1,021 pixels), the second for short pages from the 1st quartile to the median, the third as average from the median to the 3rd quartile (5,688 pixels), the fourth as long pages from the 3rd quartile to the upper bound (1.5 IQR, 12,688 pixels), and the 5th as very long pages* from the upper bound to the maximum. A new variable is introduced to mirror these categories as ordinal numbers from 1 to 5.
4.2 Correlation Analysis
A correlation analysis was performed before fitting models to investigate the relationship between page length and visitor retention rate. The Shapiro-Wilk test indicated a non-normal distribution of the data, leading to the selection of the non-parametric Spearman correlation for its appropriateness in non-normal distributions and robustness across various relationships. A sensitivity analysis, assessing Spearman's correlation at different sample size thresholds (10, 30, 50, 100), confirmed the coefficient's stability, making it a reliable choice given the dataset's characteristics of large size and tied ranks.
Table 1: Spearman Correlation Coefficients for the Relation between Page Length and Visitor Retention Rate.
| Site | Overall | Desktop | Smartphone | Tablet |
|------|---------|---------|------------|--------|
| 1 | -0.803 | -0.821 | -0.832 | -0.883 |
| 2 | -0.478 | -0.759 | -0.494 | -0.668 |
| 3 | -0.755 | -0.775 | -0.656 | -0.994 |
| 4 | -0.747 | -0.777 | -0.706 | -0.755 |
| 5 | -0.898 | -0.874 | -0.937 | -0.984 |
Significant correlations were found, as summarized in Table 1, with all p-values below 0.001. Site 2 displayed only a moderate correlation, possibly due to the dominance of mobile traffic and the mobile layout affecting the data differently. This finding highlights the importance of considering device types in model fitting, as device-specific differences can influence the relationship between page length and visitor retention.
4.3 Regression Analysis
Visualizations of data indicated a non-linear relationship so that a selection was made between a logarithmic model, an exponential decay model, and a third one using a power law. Tests with a polynomial model did not provide sufficient results at all. Given that all visitors start at the top of the page (neglecting that a visitor might get directly to a section of a page via a link with an anchor), models are constrained to start at a percentage of 100%. The exponential decay model predicts $retention$ using the formula:
This model assumes that as $pixel_depth$ increases, $retention$ will decrease exponentially. The parameter $b$ controls the rate of decay.
The constrained logarithmic model predicts retention using the formula:
This model combines a logarithmic term with parameters $a$ and $b$ to model $retention$. It introduces non-linearity, and $a$ and $b$ determine the shape of the curve. $retention$ is constrained to remain between 0 and 100.
The constrained power law model predicts $retention$ using the formula:
This model is based on a power law relationship, where $retention$ is modeled as a function of $pixel_depth$ raised to the power of $b$, scaled by $a$. Parameters $a$ and $b$ control the scaling and exponent of the relationship.
Table 2: RMSE values of different models, lowest in bold, all p-values below 0.05.
| Site | Exp. | Mod. Exp | Log. | Mod. Log. | Power | Mod. Power |
|------|-------|----------|-------|-----------|-------|------------|
| 1 | 19.61 | 17.46 | 17.32 | **17.10** | 18.16 | 18.13 |
| 2 | 18.50 | 18.33 | 14.85 | **14.79** | 14.91 | 14.83 |
| 3 | 21.19 | 15.75 | 17.44 | **14.89** | 17.58 | 17.39 |
| 4 | 19.59 | **14.31** | 21.58 | 16.90 | 19.01 | 18.47 |
| 5 | 14.47 | **13.8** | 15.06 | 14.32 | 17.03 | 17.03 |
In addition, all models have been modified to take the page length category ($plc$) into account, using an ordinal variable, as categories can be ranked according to their lengths. For the modified exponential decay model,
$pixel_depth$ is used as one independent variable instead of time that impacts the decay combined with the page length category rank as a second independent variable. The parameter $d$ modifies the decay rate based on ordinal page category rank.
The modified constrained logarithmic model predicts $retention$ as
This refined model uses $c$ to quantify the impact of the page category. The modified constrained power law model forecasts retention using the formula:
Again, $c$ is used to adjust the influence of $plc$.
The models were first used for the sites only, not taking any other variable into account. The root mean square error (RMSE) values are displayed in Table 2, all with a p-value way below 0.05. As the correlation coefficients indicated an impact of device types, the models were refitted including the device types. RMSE values of these experiments are displayed in Table 3, and model coefficients are displayed in Tables 4, 5, and 6, again with the p-value being way below 0.05.
Table 3: RMSE Values of Models including Page Length Categories and Device Types, lowest in bold, all p-values below 0.05.
| Site | Device_Type | Exp | M. Exp. | Log. | M. Log. | Power | M. Power |
|------|-------------|-------|---------|-------|---------|-------|----------|
| 1 | Desktop | 18.14 | 15.78 | 15.13 | **15.05** | 15.84 | 15.77 |
| 1 | Smartphone | 20.33 | **19.02** | 20.08 | 19.31 | 21.38 | 21.37 |
| 1 | Tablet | 18.89 | **13.26** | 15.15 | 13.32 | 15.93 | 15.82 |
| 2 | Desktop | 15.77 | 15.42 | 13.85 | **13.84** | 14.14 | 14.13 |
| 2 | Smartphone | 13.47 | 13.47 | 10.93 | **10.45** | 11.00 | 10.47 |
| 2 | Tablet | 16.14 | 14.81 | 11.90 | **11.83** | 12.06 | 12.05 |
| 3 | Desktop | 19.98 | 15.36 | 16.88 | **14.50** | 17.12 | 16.96 |
| 3 | Smartphone | 25.01 | 15.36 | 18.32 | **14.80** | 18.39 | 17.99 |
| 4 | Desktop | 19.84 | **15.51** | 21.35 | 17.66 | 19.21 | 18.87 |
| 4 | Smartphone | 19.13 | **12.57** | 21.39 | 15.81 | 18.39 | 17.58 |
| 4 | Tablet | 19.96 | **14.95** | 21.62 | 17.14 | 19.34 | 18.66 |
| 5 | Desktop | 15.43 | **14.67** | 16.00 | 15.23 | 17.36 | 17.33 |
| 5 | Smartphone | 11.28 | **10.82** | 11.50 | 10.89 | 14.38 | 14.30 |
| 5 | Tablet | 9.94 | 9.49 | 9.39 | **8.05** | 14.82 | 13.79 |
The modified exponential decay model and the modified logarithmic model showed the best results. Differentiating only by the site and including the page length category, the modified logarithmic model was better in 3 out of 5 cases. Including the device type variable, the modified exponential decay model demonstrated superior efficacy for sites 1, 4, and 5. Site 2, characterized by shorter pages and limited variation in length, and site 3 with its long and very long pages, exhibited a preference for the logarithmic model, indicating a rapid initial change in visitor behaviour that diminishes swiftly.
Table 4: Summary of Model Coefficients for Exponential Models; The device type "Tablet" is missing for site 3 due to insufficient traffic.
| Site | Device Type | Exp_b | M. Exp_b | M. Exp_d |
|------|-------------|----------|----------|-----------|
| 1 | Desktop | 2.58e-04 | 5.58e-04 | -8.77e-05 |
| 1 | Smartphone | 1.75e-04 | 3.43e-04 | -4.70e-05 |
| 1 | Tablet | 8.15e-05 | 6.51e-04 | -1.15e-04 |
| 2 | Desktop | 1.14e-03 | 2.29e-03 | -5.66e-04 |
| 2 | Smartphone | 4.57e-04 | 4.68e-04 | -5.13e-06 |
| 2 | Tablet | 9.39e-04 | 2.11e-03 | -5.56e-04 |
| 3 | Desktop | 1.55e-04 | 8.15e-04 | -1.40e-04 |
| 3 | Smartphone | 2.24e-04 | 1.56e-03 | -2.95e-04 |
| 4 | Desktop | 7.79e-04 | 1.52e-03 | -2.68e-04 |
| 4 | Smartphone | 8.86e-04 | 1.78e-03 | -3.30e-04 |
| 4 | Tablet | 8.28e-04 | 1.57e-03 | -2.83e-04 |
| 5 | Desktop | 4.94e-04 | 7.81e-04 | -1.26e-04 |
| 5 | Smartphone | 5.84e-04 | 8.63e-04 | -1.24e-04 |
| 5 | Tablet | 4.14e-04 | 6.81e-04 | -7.54e-05 |
Table 5: Summary of Model Coefficients for Logarithmic Models
| Site | Device Type | Log_a | Log_b | M. Log_a | M. Log_b | M. Log_c |
|------|-------------|--------|--------|----------|----------|----------|
| 1 | Desktop | 164.13 | -14.28 | 169.88 | -15.91 | 2.10 |
| 1 | Smartphone | 198.61 | -18.00 | 219.85 | -23.75 | 7.46 |
| 1 | Tablet | 162.09 | -12.96 | 193.51 | -21.85 | 10.56 |
| 2 | Desktop | 132.39 | -12.58 | 127.04 | -12.75 | 3.13 |
| 2 | Smartphone | 108.95 | -6.05 | 142.37 | -4.998 | -19.74 |
| 2 | Tablet | 114.53 | -9.26 | 107.61 | -9.93 | 5.30 |
| 3 | Desktop | 178.90 | -15.93 | 159.26 | -22.26 | 16.44 |
| 3 | Smartphone | 119.87 | -9.97 | 96.26 | -18.64 | 22.63 |
| 4 | Desktop | 165.34 | -17.20 | 210.84 | -29.50 | 14.98 |
| 4 | Smartphone | 137.07 | -14.12 | 195.58 | -28.90 | 18.11 |
| 4 | Tablet | 157.69 | -16.48 | 209.69 | -29.82 | 16.10 |
| 5 | Desktop | 263.71 | -29.69 | 251.35 | -31.33 | 10.72 |
| 5 | Smartphone | 299.29 | -35.43 | 287.07 | -36.34 | 8.38 |
| 5 | Tablet | 320.83 | -36.63 | 307.60 | -40.02 | 11.07 |
Table 6: Summary of Model Coefficients for Power Law Models.
| Site | Device Type | Pow a | Pow b | M. Pow a | M. Pow b | M. Pow c |
|------|-------------|---------|-------|----------|----------|----------|
| 1 | Desktop | 269.27 | -0.21 | 242.31 | -0.19 | -1.40 |
| 1 | Smartphone | 389.61 | -0.25 | 373.14 | -0.24 | -0.51 |
| 1 | Tablet | 281.63 | -0.20 | 344.99 | -0.24 | 1.58 |
| 2 | Desktop | 177.89 | -0.19 | 177.23 | -0.17 | -3.38 |
| 2 | Smartphone | 115.35 | -0.08 | 146.09 | -0.04 | -20.27 |
| 2 | Tablet | 137.97 | -0.14 | 138.44 | -0.15 | 1.81 |
| 3 | Desktop | 816.89 | -0.35 | 1274.08 | -0.43 | 1.86 |
| 3 | Smartphone | 519.92 | -0.32 | 1871.15 | -0.53 | 2.65 |
| 4 | Desktop | 1749.67 | -0.54 | 2711.44 | -0.62 | 1.83 |
| 4 | Smartphone | 3895.84 | -0.67 | 9512.46 | -0.84 | 2.39 |
| 4 | Tablet | 2160.98 | -0.58 | 4430.93 | -0.71 | 2.64 |
| 5 | Desktop | 986.32 | -0.41 | 1097.04 | -0.44 | 1.84 |
| 5 | Smartphone | 3005.36 | -0.59 | 2365.48 | -0.54 | -2.43 |
| 5 | Tablet | 2989.67 | -0.56 | 1429.42 | -0.41 | -6.53 |
The inclusion of device type in models does not always yield better results, possibly due to fewer data points for specific combinations. It is recommended to use site and page length category as alternatives when advanced models underperform.
Analysis of model coefficients from Tables 4, 5, and 6 reveals device-specific attention and engagement patterns. For the exponential decay model, coefficients ('Exp b', 'M. Exp b', 'M. Exp d') show mobile devices have a faster attention decay than desktops, suggesting vital content should be placed higher on mobile pages.
The logarithmic model's coefficients ('Log a', 'M. Log a', 'Log b', 'M. Log b') demonstrate that mobile users' attention drops more sharply, highlighting the importance of mobile-friendly content arrangement with engaging content prioritized at the page's top.
The power law model shows device-dependent variations in scaling coefficients and exponents, with smartphones displaying higher engagement initially but dropping off more quickly ('Pow a' = 389.61, 'M. Pow a' = 373.14; 'Pow b' = -0.25, 'M. Pow b' = -0.24) than desktops, adjusted further by 'M. Pow c' for page length differences.
Site 4, a transactional site, exhibits unique engagement patterns, with the exponential decay model indicating quicker attention loss on desktops ('Exp b' = 7.79e-04), accentuated by page length. The logarithmic model shows high initial desktop engagement ('Log a' = 165.34) with a significant drop-off ('Log b' = -17.20), suggesting content placement is critical.
The power law model for Site 4 reflects strong initial desktop engagement ('Pow a' = 1749.67) and a steeper decline on smartphones ('M. Pow b' = -0.84), possibly due to predictable content layout affecting visitor behavior. The study progresses with the modified exponential decay model.
4.4 Actionable Knowledge Discovery Using the Model
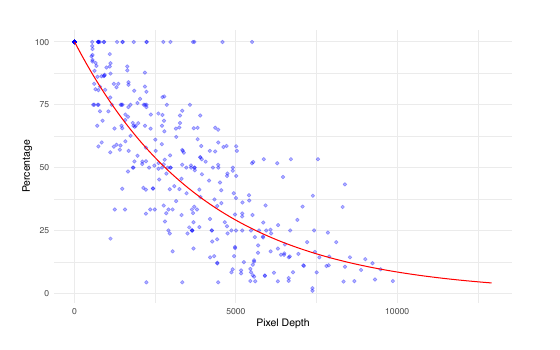
Figure 2: Observations versus Model for several pages, one device type, and one length category.
Using a model, each page's performance is analyzed by comparing model predictions to actual data for specific device and page length categories, as shown in Figure 2. Positive residuals highlight segments outperforming the model, while negative residuals indicate underperformance. However, a negative residual does not always mean that a segment is performing worse than the average across all pages. For example, Figure 2 shows that on average length pages (3,082 to 5,688 pixels), user engagement drops around 1,000 pixels, signaling areas for further investigation. Conversely, some segments keep visitors engaged beyond model expectations. This analysis is visualized as a heatmap in Figure 3, where positive (green) and negative (red) residuals are marked, providing a clear indication of performance relative to other pages within the same device and page length categories, unlike traditional web analytics heatmaps.

Figure 3: Heatmap indicating where a page of Site 2 performs better or worse on Desktop with respect to the model, the opacity indicating the deviation, red for negative, green for positive residuals.
In this example of visitor engagement on a medical practice's homepage, the content includes contact and appointment information but its performance diverges from the model's predictions: it underperforms at the top but engages more visitors at the bottom, especially in the section explaining appointment scheduling. Unexpectedly, more visitors drop off at the opening hours section and the page header, indicating areas needing improvement. Conversely, the section on making appointments retains more visitors than anticipated. Additionally, a banner about a federal digitization project fails to maintain visitor interest, suggesting content reevaluation. The end of a page is not necessarily a problem in general, as the comparison between pages in Figure 4 shows. Here, each site's top 25 pages in terms of the number of visitors are displayed, and for site 2 in particular, several pages perform better than expected at the end.
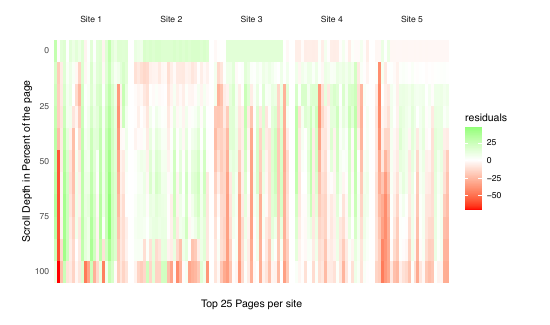
Figure 4: Heatmaps of the most requested 25 pages per Site, colours indicating the residuals.
To prioritize site optimization tasks, two metrics are calculated for each page: the sum of squared positive residuals (SSPR) and the sum of squared negative residuals (SSNR). SSPR quantifies a page's performance above expectations at certain scroll depths, while SSNR measures underperformance. The SSPR/SSNR ratio serves as a unified metric to compare page performance based on visitor scrolling engagement.
For instance, a page with a 0.908 performance ratio, despite being highly visited, ranks only 16th based on performance ratios, suggesting potential for optimization. This scenario, illustrated in Figure 3 and supported by Figure 4, is not an exception. Among top-visited pages, some underperform against model expectations, highlighting the substantial influence of content on visitor behavior without a consistent pattern across a site. However, comparing sites reveals distinct trends; for example, Site 3's long pages see a significant drop-off in visitor retention beyond the average page length, underscoring that lengthy content does not necessarily enhance visitor retention.
5 Discussion and Conclusion
While it is not a surprise that the length of a page and the device type have an impact on visitor retention, this study is the first to present a generalizable model that takes these variables into account and explains more than the data of a single site. A modified exponential decay model is recommended for the prediction of visitor behaviour due to its broader applicability across the typical web page length distribution, highlighting areas for content improvement across almost all sampled pages. While more sophisticated models may promise better predictions, this work's focus is on models that can be easily be used even with the data of only a few hundred visitors and that do not require a bespoke setup. The methodology proposed in this study can be readily implemented. By utilizing widely available analytics software such as Matomo and incorporating standard scrolling data, website owners can effectively leverage these models to derive actionable insights. Including page length categories in the model has shown positive impacts on results, suggesting that visitor expectations and content visibility play significant roles. This indicates a need for further research to explore the influence of perceived page length on visitor engagement.
Model coefficients offer insights for optimizing content placement, especially on mobile devices, where top positioning is crucial. Desktop content can afford to be more detailed, allowing engagement with material further down the page. However, variances in page engagement are observed, noting that neither short nor long pages guarantee retention, with specific site examples illustrating the need to generate automated optimization recommendations per page.
The current methodology has several limitations. It does not include pages with horizontal or infinite scrolling (e.g., LinkedIn). Design elements that might influence scrolling, such as font size, are not considered. Although timestamps are available, they were not used, even though combining scroll depth with time spent could yield more precise insights. Lastly, the study introduces only one Actionable Knowledge Discovery method for analyzing web analytics data, highlighting a vast area for future research to expand upon analytical methods in this field.
References
Tom Alby. 2023. The Data Dilemma: Google Analytics' Untapped Potential and Web Data Literacy. In Proceedings of the LWDA 2023 Workshops: BIA, DB, IR, KDML and WM. CEUR Workshop Proceedings, Marburg, Germany, 311–324.
Tom Alby. 2023. Popular, but hardly used: Has google analytics been to the detriment of web analytics?. In Proceedings of the 15th ACM web science conference 2023 (WebSci '23). Association for Computing Machinery, New York, NY, USA, 304–311. https://doi.org/10.1145/3578503.3583601
Tom Alby and Robert Jäschke. 2022. Analyzing the web: Are top websites lists a good choice for research?. In Linking theory and practice of digital libraries, Gianmaria Silvello, Oscar Corcho, Paolo Manghi, Giorgio Maria Di Nunzio, Koraljka Golub, Nicola Ferro, and Antonella Poggi (Eds.). Springer International Publishing, Cham, 11–25.
Max Boisot and Agusti Canals. 2004. Data, information and knowledge: have we got it right? Journal of Evolutionary Economics 14, 1 (Jan. 2004), 43–67. https://doi.org/10.1007/s00191-003-0181-9
Claudia Brauer, David Reischer, and Felix Moedritscher. 2014. What web analysts can do for human-computer interaction?. In HCIB 2014. Lecture Notes in Computer Science, Nah, Fiona Fui-Hoon (Ed.), Vol. 8527. Springer International Publishing, Cham, 471–481. https://doi.org/10.1007/978-3-319-07293-7_46
Alex Brown, Binky Lush, and Bernard J. Jansen. 2016. Pixel efficiency analysis: A quantitative web analytics approach. Proceedings of the Association for Information Science and Technology 53, 1 (2016), 1–10. https://doi.org/10.1002/pra2.2016.14505301040
Georg Buscher, Ludger Van Elst, and Andreas Dengel. 2009. Segment-level display time as implicit feedback: a comparison to eye tracking. In Proceedings of the 32nd international ACM SIGIR conference on Research and development in information retrieval. ACM, Boston MA USA, 67–74. https://doi.org/10.1145/1571941.1571955
Dave Chaffey and Mark Patron. 2012. From web analytics to digital marketing optimization: Increasing the commercial value of digital analytics. Journal of Direct, Data and Digital Marketing Practice 14, 1 (July 2012), 30–45. https://doi.org/10.1057/dddmp.2012.20
Chris Coyier. 2016. Google Analytics Can Show You Screen Resolution not equal to Browser Window. https://alby.link/resolution
D.J. Clark, David Nicholas, and Hamid R. Jamali. 2014. Evaluating information seeking and use in the changing virtual world: the emerging role of Google Analytics. Learned Publishing 27, 3 (July 2014), 185–194. https://doi.org/10.1087/20140304
Rik Crutzen, Johanna L. Roosjen, and Jos Poelman. 2013. Using google analytics as a process evaluation method for internet-delivered interventions: An example on sexual health. Health Promotion International 28, 1 (2013), 36–42. https://doi.org/10.1093/heapro/das008
Wei Fang. 2006. Using google analytics for improving library website content and design: A case study. Library Philosophy and Practice, ISSN 1522-0222, Vol. 9, Nº. 2, 1, 2007 1 (Nov. 2006), 1–17. https://doi.org/10.7282/T3MK6B6N
Tabatha A. Farney. 2011. Click Analytics: Visualizing Website Use Data. Information Technology and Libraries 30, 3 (Sept. 2011), 141–148. https://doi.org/10.6017/ital.v30i3.1771
Max Grusky, Jeiran Jahani, Josh Schwartz, Dan Valente, Yoav Artzi, and Mor Naaman. 2017. Modeling Sub-Document Attention Using Viewport Time. In Proceedings of the 2017 CHI Conference on Human Factors in Computing Systems. ACM, Denver Colorado USA, 6475–6480. https://doi.org/10.1145/3025453.3025916
Conor Mc Guckin, Niall Crowley, and D. Couns. 2012. Using google analytics to evaluate the impact of the cyberTraining project. Cyberpsychology, Behavior, and Social Networking 15, 11 (2012), 625–629. https://doi.org/10.1089/cyber.2011.0460
Layla Hasan, Anne Morris, and Steve Probets. 2009. Using Google Analytics to Evaluate the Usability of E-Commerce Sites. In Human Centered Design, Masaaki Kurosu (Ed.). Vol. 5619. Springer Berlin Heidelberg, Berlin, Heidelberg, 697–706. https://doi.org/10.1007/978-3-642-02806-9_81 Series Title: Lecture Notes in Computer Science.
Verena Hausmann, Susan P. Williams, and Petra Schubert. 2012. Developing a framework for web analytics. In 25th Bled eConference - eDependability: Reliable and Trustworthy eStructures, eProcesses, eOperations and eServices for the Future, Proceedings. Springer, Bled, Slovenia, 127–140.
Joel Järvinen and Heikki Karjaluoto. 2015. The use of Web analytics for digital marketing performance measurement. Industrial Marketing Management 50 (2015), 117–127. https://doi.org/10.1016/j.indmarman.2015.04.009
Nasrin Kalanat. 2022. An overview of actionable knowledge discovery techniques. Journal of Intelligent Information Systems 58, 3 (June 2022), 591–611. https://doi.org/10.1007/s10844-021-00667-4
Diane Kelly and Nicholas J. Belkin. 2004. Display time as implicit feedback: understanding task effects. In Proceedings of the 27th annual international ACM SIGIR conference on Research and development in information retrieval. ACM, Sheffield United Kingdom, 377–384. https://doi.org/10.1145/1008992.1009057
Russel Ketchum. 2022. Prepare for the future with Google Analytics 4. https://blog.google/products/marketingplatform/analytics/prepare-for-future-with-google-analytics-4/
Ilan Kirsh. 2021. Visualizing Web Users' Attention to Text with Selection Heatmaps. In Web Engineering, Marco Brambilla, Richard Chbeir, Flavius Frasincar, and Ioana Manolescu (Eds.). Vol. 12706. Springer International Publishing, Cham, 517–520. https://doi.org/10.1007/978-3-030-74296-6_42 Series Title: Lecture Notes in Computer Science.
Ilan Kirsh. 2022. Exploring Text Highlighting and Copying by Web Users on a Website: A Case Study. SN Computer Science 3, 4 (July 2022), 278. https://doi.org/10.1007/s42979-022-01146-5
Ilan Kirsh and Mike Joy. 2020. A Different Web Analytics Perspective Through Copy to Clipboard Heatmaps. In Web Engineering, Maria Bielikova, Tommi Mikkonen, and Cesare Pautasso (Eds.). Vol. 12128. Springer International Publishing, Cham, 543–546. https://doi.org/10.1007/978-3-030-50578-3_41 Series Title: Lecture Notes in Computer Science.
Ilan Kirsh and Mike Joy. 2020. Splitting the Web Analytics Atom: From Page Metrics and KPIs to Sub-Page Metrics and KPIs. In Proceedings of the 10th International Conference on Web Intelligence, Mining and Semantics. ACM, Biarritz France, 33–43. https://doi.org/10.1145/3405962.3405984
Dmitry Lagun and Mounia Lalmas. 2016. Understanding User Attention and Engagement in Online News Reading. In Proceedings of the Ninth ACM International Conference on Web Search and Data Mining. ACM, San Francisco California USA, 113–122. https://doi.org/10.1145/2835776.2835833
Chao Liu, Ryen W. White, and Susan Dumais. 2010. Understanding web browsing behaviors through Weibull analysis of dwell time. In Proceeding of the 33rd international ACM SIGIR conference on Research and development in information retrieval - SIGIR '10. ACM Press, Geneva, Switzerland, 379. https://doi.org/10.1145/1835449.1835513
Heng Luo, Stevie Rocco, and Carl Schaad. 2015. Using Google Analytics to Understand Online Learning: A Case Study of a Graduate-Level Online Course. In 2015 International Conference of Educational Innovation through Technology (EITT). IEEE, Wuhan, China, 264–268. https://doi.org/10.1109/EITT.2015.62
Kamran Mir, Ali Tahir, and Hajrah Amir. 2023. Google Analytics for User-Centered Design: A Case Study In Open and Distance e-Learning. nternational Journal on Open and Distance E-Learning 9, 1 (2023), 1–14. https://doi.org/10.58887/ijodel.v9i1.111
H. Pakkala, K. Presser, and T. Christensen. 2012. Using Google Analytics to measure visitor statistics: The case of food composition websites. International Journal of Information Management 32, 6 (2012), 504–512. https://doi.org/10.1016/j.ijinfomgt.2012.04.008
Fryda Palomino, Freddy Paz, and Arturo Moquillaza. 2021. Web Analytics for User Experience: A Systematic Literature Review. In Design, User Experience, and Usability: UX Research and Design, Marcelo M. Soares, Elizabeth Rosenzweig, and Aaron Marcus (Eds.). Vol. 12779. Springer International Publishing, Cham, 312–326. https://doi.org/10.1007/978-3-030-78221-4_21
Patrick Cheong-Iao Pang, Megan Munsie, and Shanton Chang. 2023. A Method for Analyzing Navigation Flows of Health Website Users Seeking Complex Health Information with Google Analytics. Informatics 10, 4 (Oct. 2023), 80. https://doi.org/10.3390/informatics10040080
Emily January Petersen and Breeanne Matheson Martin. 2015. Misuse, play, and disuse: Technical and professional communication's role in understanding and supporting website owners' engagement with Google Analytics. In 2015 IEEE International Professional Communication Conference (IPCC). IEEE, Limerick, Ireland, 1–5. https://doi.org/10.1109/IPCC.2015.7235786
Beatriz Plaza. 2011. Google Analytics for measuring website performance. Tourism Management 32, 3 (2011), 477–481. https://doi.org/10.1016/j.tourman.2010.03.015
Denise Quintel and Robert Wilson. 2020. Analytics and privacy: Using matomo in EBSCO's discovery service. Information Technology and Libraries 39, 3 (Sept. 2020), 1–11. https://doi.org/10.6017/ital.v39i3.12219
N. S. Redkina. 2018. Library Sites as Seen through the Lens of Web Analytics. Automatic Documentation and Mathematical Linguistics 52, 2 (March 2018), 91–96. https://doi.org/10.3103/S0005105518020073
Manya Sleeper, Sunny Consolvo, and Jessica Staddon. 2014. Exploring the benefits and uses of web analytics tools for non-transactional websites. In Proceedings of the 2014 conference on Designing interactive systems. ACM, Vancouver BC Canada, 681–684. https://doi.org/10.1145/2598510.2598555
Uzi Smadja, Max Grusky, Yoav Artzi, and Mor Naaman. 2019. Understanding Reader Backtracking Behavior in Online News Articles. In The World Wide Web Conference. ACM, San Francisco CA USA, 3237–3243. https://doi.org/10.1145/3308558.3313571
Amy Vecchione, Deana Brown, Elizabeth Allen, and Amanda Baschnagel. 2016. Tracking User Behavior with Google Analytics Events on an Academic Library Web Site. Journal of Web Librarianship 10, 3 (July 2016), 161–175. https://doi.org/10.1080/19322909.2016.1175330
W3Techs. 2023. Hotjar vs. CrazyEgg vs. Koko Analytics usage statistics, December 2023. https://w3techs.com/technologies/comparison/ta-crazyegg,ta-hotjar,ta-kokoanalytics
W3Techs. 2023. Usage Statistics and Market Share of Google Analytics for Websites, December 2023. https://w3techs.com/technologies/details/ta-googleanalytics
WAA Standards Committee. 2008. Web Analytics Association Web Analytics Definitions – Draft for Public Comment 9/22/2008. https://web.archive.org/web/20090117112455/http://webanalyticsassociation.org/attachments/committees/5/WAA_Web_Analytics_Definitions_20080922_For_Public_Comment.pdf
Chong Wang, Shuai Zhao, Achir Kalra, Cristian Borcea, and Yi Chen. 2019. Webpage Depth Viewability Prediction Using Deep Sequential Neural Networks. IEEE Transactions on Knowledge and Data Engineering 31, 3 (March 2019), 601–614. https://doi.org/10.1109/TKDE.2018.2839599
Web Analytics Association. 2011. Outlook 2011: Survey Report.
Andrea Wiggins. 2008. Information architecture: Data-driven design: Using web analytics to validate heuristics system. Bulletin of the American Society for Information Science and Technology 33 (June 2008), 20–24. https://doi.org/10.1002/bult.2007.1720330508
Xing Yi, Liangjie Hong, Erheng Zhong, Nanthan Nan Liu, and Suju Rajan. 2014. Beyond clicks: dwell time for personalization. In Proceedings of the 8th ACM Conference on Recommender systems. ACM, Foster City, Silicon Valley California USA, 113–120. https://doi.org/10.1145/2645710.2645724
Darius Zumstein, Claudia Brauer, and Andrea Zelic. 2022. Benefits, challenges and future developments in digital analytics in German-speaking countries: An empirical analysis. Applied Marketing Analytics 7 (2022), 246–259.
Irem Önder and Adiyukh Berbekova. 2022. Web analytics: more than website performance evaluation? International Journal of Tourism Cities 8, 3 (Aug. 2022), 603–615. https://doi.org/10.1108/IJTC-03-2021-0039
Do you like what you are reading? Subscribe to receive updates.
Unsubscribe anytime