
PAIRWISE – From Spatial Structure to Knowledge
Daniel Roßner (Corresponding author), Hof University, Institute for Information Systems, Hof, Germany; University of Bamberg, Human-Computer Interaction Group, Bamberg, Germany · daniel.rossner@iisys.de — Lisa Eidloth, Hof University, Institute for Information Systems, Hof, Germany · lisa.eidloth@iisys.de — Claus Atzenbeck, Hof University, Institute for Information Systems, Hof, Germany · claus.atzenbeck@iisys.de
Published in HT '24: 35th ACM Conference on Hypertext and Social Media · DOI: 10.1145/3648188.3675137 · License: CC BY 4.0
Authors: Claus Atzenbeck, Lisa Eidloth, Daniel Roßner
Keywords: information exploration, information representation, knowledge, spatial hypertext, user study, visualization
Session: New Directions
Pages: 208–216
Conference: HT'24
Abstract
This paper posits that spatially structured concepts can function as a visual representation of knowledge, a notion supported by common methods of eliciting and presenting mental models. Despite an existing gap in understanding the correlation between visual structure and knowledge representation, this study aims to clarify this relationship. To this end, we conducted a study wherein participants rated pairwise relationships between ten concepts on a discrete scale ranging from one to ten. Subsequently, we compared these ratings with weights derived from the distances between concepts in human-generated spatial structures. Our findings unveil a linear relationship between the weights obtained through both methods, indicating that spatial arrangements may systematically reflect and encode knowledge.
CCS Concepts
• Information systems → Search interfaces; • Human-centered computing → User studies; Hypertext / hypermedia; Graphical user interfaces.
Keywords
spatial hypertext, knowledge, user study, information representation, visualization, information exploration
ACM Reference Format
Daniel Roßner, Lisa Eidloth, and Claus Atzenbeck. 2024. PAIRWISE – From Spatial Structure to Knowledge. In 35th ACM Conference on Hypertext and Social Media (HT '24), September 10–13, 2024, Poznan, Poland. ACM, New York, NY, USA, 9 pages. https://doi.org/10.1145/3648188.3675137
1 Introduction
The arrangement and visualization of units of information (concepts), whether done digitally or analogously, in a 2D (or even 3D) space is a human intuitive activity. It is used for externalizing or communicating knowledge on an individual or cooperative level. This presupposes, that arranging and clustering information units reflects human knowledge within the range of information presented (explicitly or implicitly) in the workspace. Spatial hypertext systems use this structure, particularly the proximity values of spatial nodes, as a basis for spatial parsing and for building context to query the underlying knowledge base. This means the system must assess a human-built spatial structure as accurately as possible in terms of the knowledge it reflects. In cognitive science, mapping out units of information is not only a common method for eliciting and assessing the mental models of individuals, but may also serve as a means to augment existing mental models. When performed by a computer system, this process requires an accurate transfer of human-generated structure to a more formalized representation of knowledge, enabling the system to incorporate "suitable" information. Despite its importance, there is currently a lack of understanding and knowledge about the correlation between the proximity of information entities in a 2D workspace and a knowledge representation by the system. The presented study found a linear correlation between these factors.
2 Mental Models
Despite years of discussion on the concept of mental models, a uniform definition and understanding are still lacking. This may be attributed to the interdisciplinary nature and application of the mental models theory. Doyle provided a brief summary of various viewpoints on mental models in 1989 [11], as did Rook in 2013 [30], who also attempted to propose a new definition. We will adopt a widely recognized and generally stated definition: Mental models are simplified conceptual representations stored in long-term memory, reflecting an individual's understanding of the structure of an external system [9, 21]. They emerge through interaction with the external world, making them inherently subjective [28]. It is suggested that mental models comprise two major components: knowledge structures and the knowledge on how to use them [27].
Mental models are indispensable for predicting system behavior and are a basis for informed decision-making and problem-solving. They hold previously acquired knowledge of external systems and facilitate inference in current situations, which is crucial when dealing with complex systems [14, 22]. The ability to perform in complex systems (heuristic competence [5]) has been discussed in the literature for years (e.g., [2, 13, 39]) and has become increasingly important in recent years [5]. In such systems, various actors and (time delayed) feedback may affect the decision-making or problem-solving process. Also, what has been shown to be decisive for performance, is mental model accuracy [13, 39], as well as the understanding of the system's inherent causal relationships. This holds true, especially for ill-defined problem-types [10]. Further, misinterpreting feedback or incorrectly accumulating knowledge structures may also lead to failure [3, 5, 37]. Remarkably, presenting system-information to experts who already possess highly detailed mental models may lead to a decline in decision-making performance (expertise reversal effect) [1]. The presented information might be redundant to these people, imposing a cognitive load [41].
A possible way for improving decision-making and problem-solving qualities may be the increase of transparency of a system by providing structural information about it [5]. In particular, the communication of underlying causal structures may support the construction and reassessment of knowledge [19]. Also, analogous inference from existing mental models is crucial when exploring new and complex problem spaces in the outside world. Findings from Gary indicated that "rigorous, unconfounded exploration of the problem space facilitates accurate inferences about the structural relations in the source situation" [12]. This means that either mapping out and refining an existing mental model or exploring, for example, a structural representation of a new problem space, may enhance an individual's ability to handle complex situations in the outside world.
Computer systems that support processes of model building or model mapping may include spatial hypertext systems with recommender functionality (e.g., SPORE [31]). By utilizing such systems, users can elicit, reflect and refine their mental models on specific topics in an exploratory manner. This may also foster creativity, which is an important factor for making analogous inferences from existing mental models [17, 25]. These systems utilize spatial proximity to express the interconnectivity of information, often without explicitly naming the type of relationship. This approach may be conducive to the highly subjective nature of mental models and, on the other hand, foster creativity. Additionally, these systems offer high controllability to users over the presented information, which may mitigate the issue of presenting redundant information to experts, as discussed earlier. However, further research is needed to fully understand and validate these conclusions.
3 Visual Structure and Knowledge
It may be argued that spatially structured entities, such as those found in spatial hypertext, serve as a simplified visual depiction of knowledge pertaining to a particular system. This visual representation evolves in accordance with the user's comprehension and manipulation of the system. Spatial hypertext systems like SPORE [31] utilize human generated and successively manipulated visual structure as a basis for spatial parsing and for building a query context. This query context influences the selection of recommendations presented to the user. Eventually, the system aims at providing recommendations aligned with a user's intention, thereby augmenting their existing knowledge. Consequently, the system must assess a user's current knowledge by analyzing the visual structure the user is constructing. This describes the direct use of externalized knowledge by a system. However, there still exists a deficiency in both evidence and understanding regarding the correlation between visual structure and its characteristics, such as the proximity of entities or the application of color or shape-based clustering, and knowledge in a spatial hypertext. Also, there is no single valid way to express one's knowledge. This may especially be of interest, when using a system collaboratively.
4 User Study
In order to contribute to the question on how visual structure is related to an individual's mental model (knowledge) and how this relation can be leveraged by a computer system on a 2D workspace, a user study was conducted. This study examined the perceived semantic relationships of information entities, which were rated on a numerical scale and arranged in a 2D workspace.
4.1 Objectives
As described in Section 3, spatial structures may be analyzed by a spatial parser in order to capture a user's knowledge and possible intentions. The parser aims to extract meaningful representations and relationships from spatial data, enabling the system to comprehend and interpret visual structures akin to a language with a certain syntax and in a manner similar to human perception [16]. This syntax is mostly based on visual cues, such as spatial arrangements, layouts, and contextual cues, but is also highly bound to the individual creating the structure. Although spatial hypertext has been formally defined in [34], the emerging characteristic of the expressed structure cannot be covered by a formal grammar at a satisfactory level. Instead, spatial parsers use heuristics to uncover some of the intended structure. Notable implementations can be found in VIKI [26], VKB [36], CAOS [29], VITE [20], or the spatio-visual parsers implemented by Schedel [34, 35]. This study aims to gain insights into the alignment of individual ratings of spatial relationships between entities of information with an established baseline of ratings on a numerical scale. Our findings can contribute to further develop suitable heuristics for spatial parsing and system-based visual composition in spatial hypertext systems.
4.2 Method
4.2.1 Paired Comparison Rating
This method is aligned with commonly used techniques for assessing mental models [15, 33]. Respondents were asked to provide ratings of the semantic relatedness of concepts, they were already familiar with. To avoid ties, a rating scale ranging from 1 to 10 was selected. The concepts chosen were in German, as the participants were native German speakers. Figure 1 illustrates the configuration featuring a sample pair of concepts.
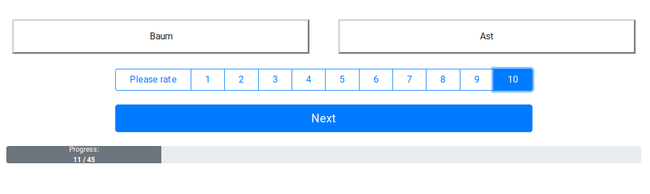
Figure 1: Pairwise comparison between "Baum" (tree) and "Ast" (branch); rated with a ten
4.2.2 Spatial Compositing
This method follows the (graphical) mental model elicitation technique [18]. Unlike in commonly used graphical elicitation techniques, participants were not instructed to provide a graphical representation of relationships between entities (e.g., lines connecting entities). Instead, links between entities were automatically computed as visible lines, with their thickness varying based on the proximity of the connected entities (see Figure 2). Nonetheless, the significance of proximity, as a factor for expressing relationships and their strength, was not explicitly communicated to participants. Respondents were tasked with arranging information entities in a 2D workspace according to their perceived semantic relationships. Participants were instructed to work intuitively and assured that there were no "wrong" solutions to this task.
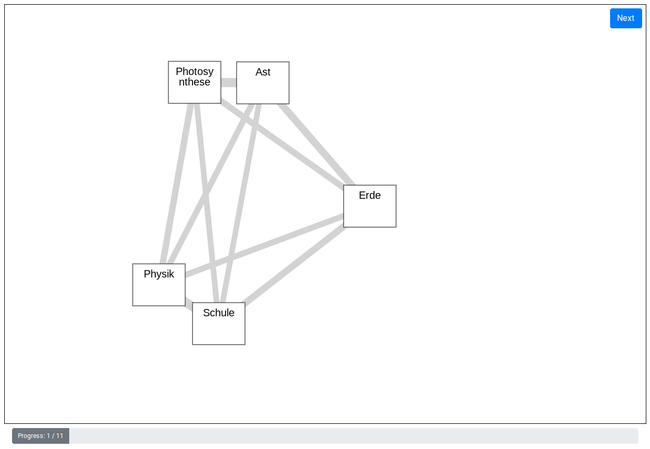
Figure 2: Spatial test instance with five concepts (i.e., nodes in a spatial hypertext); thickness of lines is an indicator of distance
4.2.3 Interview
A short interview (duration of approximately five minutes) between each participant and the researcher was conducted to clarify actions, for example the overlapping placement of items within spatial compositing part of the study and the participant's intention behind it. In general, we used this interview to gain insights into what participants were thinking during the test, including whether certain actions were intentional or unconscious.
4.3 Setting
The test system is implemented as a Web application, based on the Vue.js framework<sup>1</sup>, enabling participants to conduct the test remotely. Figure 1 and Figure 2 are exemplary screenshots of the application. The test was conducted either by direct communication or via video conference<sup>2</sup>. Further, participants were allowed to use a device of their choice (e.g., their own device), with which they felt comfortable. Values were recorded for the width of the canvas, ranging from 1319px to 2530px, and a fixed height of 800px<sup>3</sup>.
<sup>1</sup> https://vuejs.org
<sup>2</sup> https://zoom.us/
<sup>3</sup> Pixels (px) are relative to the viewing device. For low-dpi devices, 1px is one device pixel (dot) of the display. For printers and high resolution screens, 1px implies multiple device pixels.
4.4 Participants
Thirteen native German speakers, aged between 15 and 65 ($bar{x} = 38$) with a majority of male participants ($f_i approx 0.62$) were recruited through convenience sampling, aiming for a demographically diverse group with respect to age and educational/professional background. Three participants were familiar with the topic of (spatial) hypertext, while the others had no IT or research-related background. Five of the participants took part in the study via video conference. Before conducting the study, informed consent for data collection was obtained from all participants. Participation was optional, and no compensation was given.
4.5 Measures
During the test, interactions with the system were recorded and stored. For pairwise evaluations, the duration from the moment a pair of concepts is displayed until the "Next" or "Finish" button is pressed was measured. Additionally, the order in which concepts were displayed, and pairwise ratings were saved. Within the spatial variant of the test, the time per instance and the following measures were recorded:
Concepts of an instance and their initial order when stacked
Resolution and dimensions of the browser window during the test
The movement of objects, the updated positions and the order of those events, such that a detailed replay of an instance and/or session is possible (a movement is triggered when an object is pressed, the mouse (together with the object) moves and the button is released)
The number of clicks each concept registers; determined by a mouse button press followed by its release, irrespective of any mouse movement in the meantime
4.6 Procedure
To minimize the number of variables, a fixed quantity of concepts, each represented as a rectangle of uniform size and containing a single word describing the concept, was presented within a 2D workspace. The entities could be freely arranged, but participants were restricted from deleting or altering them in terms of size, shape, color, any other visual attribute, as well as their content. Zooming and panning were disabled within the workspace to maintain consistent entity sizes across all participants. Furthermore, it was ensured that each concept was easily distinguishable (i.e., readable) by selecting an appropriate text size that ensured readability and maintaining sufficient contrast for optimal visibility. The concepts selected were intentionally simple, chosen based on the assumption that each participant would be familiar with them before the test (see Table 1). These concepts were chosen to represent various types of semantic relationships, such as hierarchical connections (e.g., tree to leaf, building to school) and logical associations (e.g., school and teacher). While some concepts naturally exhibit clear relationships (or lack thereof), others possess more debatable connections, such as teacher and tree.
Table 1: The ten concepts and their English translation
| Concept | Translation |
| --- | --- |
| Laub | (fallen) leaves |
| Baum | tree |
| Lehrer | teacher |
| Schule | school |
| Infrastruktur | infrastructure |
| Ast | branch |
| Fahrrad | bicycle |
| Physik | physics |
| Photosynthese | photosynthesis |
| Erde | earth/soil/ground |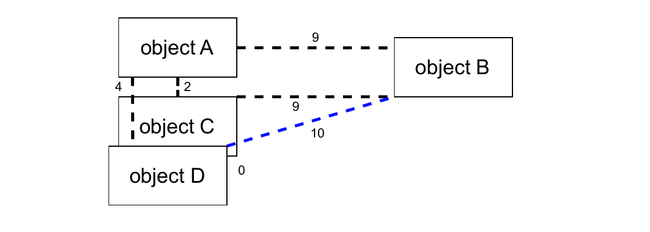
Figure 3: Four objects and their distance measured in line dashed; longest distance is highlighted in blue (10)
The study comprised two tasks, which were done sequentially: First, respondents were asked to assess the relationship between each pair of concepts using a provided numerical scale ranging from 1 to 10, where 1 indicated "the two concepts are barely or not related" and 10 indicated "the two concepts are very closely related" (see Figure 3). The ratings served as the basis for each participant's knowledge. Participants were also advised to write down "remarkable" pairs of concepts for later assessment. Next, users were assigned the task of arranging the aforementioned concepts on a 2D workspace based on their perceived relationships (see Equation 1). Participants were cued that proximity and structure are important to this task. Apart from that, they were provided with minimal instruction on how to arrange concepts, and were instead encouraged to intuitively find an arrangement.
Since the workspace did not support zooming or viewport movement, it was impractical to display all concepts ($N = 30$) simultaneously. Moreover, the complexity of organizing a large number of concepts within a workspace could overwhelm participants or even result in frustration. Therefore, to mitigate this issue, the number of simultaneously presented concepts was decreased, and participants were instructed to complete multiple instances of the task, each with a different sequence of concepts.
The visual structure created for each instance was analyzed by a spatial parser to determine the strength of the relationship between each pair of concepts. For this test, a rather simple parsing method was applied: It is assumed that the closer two concepts are in proximity, the stronger their relationship. This method does not consider detecting larger visually connected groups of objects or the temporal sequence in which the concepts were handled by the participant. Therefore, the distance between objects is used to measure the extent of their visual relation relative to the greatest distance within an instance. As depicted in Figure 3, the parser calculates the distances between four ($n$) objects ($O_1, O_2, ldots, O_n$). The greatest measured distance occurs between objects D and B. For the sake of simplicity in this illustration, the distance is represented by the number of dashes on the line (where $N_{max} = 10$). Objects C and D overlap, resulting in a distance of 0. In the subsequent step, all distances are standardized using the greatest distance $d_{max}$ as the reference point, and a rating $R(O_i, O_k)$ is calculated as follows:
The resulting ratings for the sample depicted in Figure 3 are shown in Table 2. Note that a relationship rating of 1 can only be achieved if two objects touch or overlap.
Table 2: Interpreted ratings, based on the visual structure depicted in Figure 3
| $O_i$ | $O_k$ | R |
| --- | --- | --- |
| A | B | 0.1 |
| A | C | 0.8 |
| A | D | 0.6 |
| B | C | 0.1 |
| B | D | 0.0 |
| C | D | 1.0 |
4.7 Preliminary Test
To determine crucial factors for the outlined test setup, the design underwent testing and refinement through a preliminary test with 34 participants (undergraduate students at Hof University, Germany), during which the following factors were established<sup>4</sup>:
Definition of a suitable number of concepts in total: $N = 10$ ($N = 30$)
Number of pairwise ratings with a numerical scale: $N = 45$ ($N = 8$)
Number of concepts per spatial interface instance: $N = 5$ ($N = 5$)
Number of spatial interface instances which participants would be asked to solve: $N = 11$ ($N = 4$)
<sup>4</sup> The numbers used in the preliminary test are indicated in parentheses.
During the preliminary test, each participant completed both versions (i.e., paired comparison ratings and spatial compositing). The time taken to complete these tasks, the positions of the concepts in the spatial interface and the screen sizes used by participants were recorded by the system. Upon examining the selected numbers, it becomes apparent that individuals rate only a portion of the entire data set: If $n$ denotes the number of concepts, then there are $Delta_{n-1}$ edges.
Given the number of 30 concepts selected for the preliminary test, there are 435 distinct pairs of concepts. However, only 8 of these pairs were evaluated in this case. With 34 participants, a maximum of 272 pairs could have been assessed. This implies that an analysis of the ratings might not yield significant insights. Nevertheless, this was not a primary concern for the preliminary test, as its aim was to evaluate the test setup in general. The time recorded for the paired comparison ratings was seven seconds for one pair ($bar{x}$), therefore, it took approximately one minute to complete the task.
The spatial interface used for the spatial compositing task enabled participants to rate a greater number of concept pairs. According to Equation 2, ten unique pairs can be generated, given the five concepts displayed in one instance. On average, one instance of the spatial compositing task was completed in 28 seconds ($bar{x}$), therefore, one session took approximately two minutes. It was observed that some respondents, even though participation in the study was voluntary, "skipped" some spatial instances by not moving any concept. This behavior might be attributed to a lack of motivation, insufficient instructions from the researcher, or an excessive mental load while performing the task. The test was therefore adjusted to a smaller number of total concepts (from 30 to 10). Additionally, the number of pairwise comparisons was increased from 8 to 45. This adjustment also ensures that each participant rates all possible edges of the resulting knowledge graph. Additionally, this supports to counteract the possibility of the resulting knowledge graph becoming inadequate for deriving meaningful conclusions, particularly if there are too many concepts and/or an insufficient number of participants.
Due to a wide range of recorded screen sizes, five concepts were considered an adequate number for the spatial variant. This ensured that all concepts could be displayed on the screens without necessitating scrolling, which could potentially increase the mental load during the test. Conversely, reducing the number of concepts per instance, could potentially result in less complex and ambiguous structures.
In order to have ratings for all pairs of concepts, at least five instances would be required for each session of spatial compositing. Since each pair is rated in context of other pairs, and the spatial session should have a similar duration to the pairwise comparison, each participant was asked to solve 11 instances. This ensures that each pair appears in at least two different contexts, which should lead to more accurate results.
To improve the quality of participant responses, each participant received individual instructions and was encouraged to ask questions about the system. Additionally, each test session was observed by an instructor to gather feedback from participants' verbalized thought processes during the test.
5 Results
All 13 participants completed the assigned tasks. However, one participant encountered an issue during spatial sessions that required moving concepts to organize them. It was possible to inadvertently drag these concepts out of the visible area, rendering them unrecoverable. To prevent this from influencing the results, data from this specific session were excluded from the analysis presented in the following. Table 3 shows a summary of the measured task durations and the inferred ratings. The scores for spatial sessions are calculated as described in Equation 1, and the values of the pairwise comparison are adjusted to a normalized range of 0 to 1 to ensure consistency.
Table 3: Summary of rating and duration measurement for both tasks
| | Duration (in s) min | Duration (in s) mean | Duration (in s) max | Rating min | Rating mean | Rating max |
| --- | --- | --- | --- | --- | --- | --- |
| Pairwise Comparison | 2.7 | 6.3 | 11.7 | 0.09 | 0.49 | 1.00 |
| Spatial Session | 17.4 | 30.5 | 51.9 | 0.24 | 0.51 | 0.88 |
The objective of this study is to validate the alignment of the inferred ratings of the spatial variant with the established baseline of the pairwise comparison ratings. This was achieved through a comparative analysis of the 45 pairwise values. The mean absolute error (MAE) between the two variants is quantified as 0.10, with the distribution represented in two box plot charts cf. Figure 4. Before conducting tests to assess correlation, it is essential to ensure shared understanding among participants regarding the intensity of relationships between concepts. Consequently, the single-score intraclass correlation<sup>5</sup> for all participants in the pairwise comparison task is calculated. The $ICC(A, 1)$ falls within the 95% confidence interval of $0.42 < 0.533 < 0.68$. An F-test, used to compare both distributions, confirms the null hypothesis of equal variance with $p < 0.001$. However, both box plots and a Shapiro-Wilk-test, which accepted the null hypothesis with $p < 0.005$ for both distributions, do not support normality. The ICC-value indicates moderate [23] to good [7] inter-rater agreement. Cohen's weighted kappa (squared distance off diagonal) aligns with $ICC(A, 1)$ [38], and according to the interpretation proposed by Landis and Koch [24], this denotes a "substantial" inter-rater agreement.
<sup>5</sup> $ICC(A, 1)$: Two-way random, single measures, absolute agreement
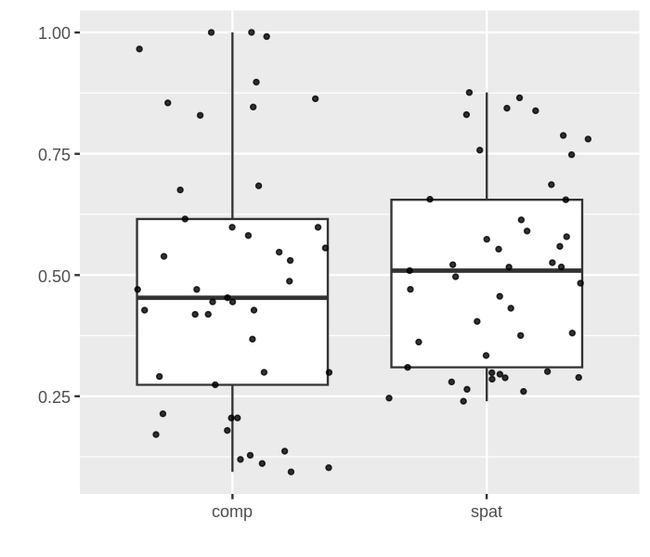
Figure 4: Inferred ratings for pairwise comparison and the spatial task
The pairwise rating decisions of the participants vary in both value and variance. While some pairs are consistently rated, others are more controversial and exhibit greater variance. Figure 5 shows the mean rating for each pair and their level of "controversy". The pairs Baum (tree)/Ast (branch) and Schule (school)/Lehrer (teacher) achieved the highest average rating of 1.0 and the lowest variance of 0.0. The pair Lehrer (teacher)/Laub (leaves) received the lowest rating at 0.009. The most controversial pair in terms of variance, with a value of 0.12, is Physik (physics)/Infrastruktur (infrastructure).
To assess the correlation between the ratings of both variants, the mean weights are rendered on a scatter plot and fitted with a linear model (lm) with a 95% confidence interval, cf. Figure 6. Correlation is tested with Kendall's rank correlation tau, as the ratings do not follow a normal distribution. The resulting Tau-b value is $tau = 0.754$ with $p < 0.001$, therefore we can accept the null hypothesis of Tau not equal to 0. According to Botsch [4] and Cohen [8], a tau value of $tau > 0.5$ suggests a strong relationship.
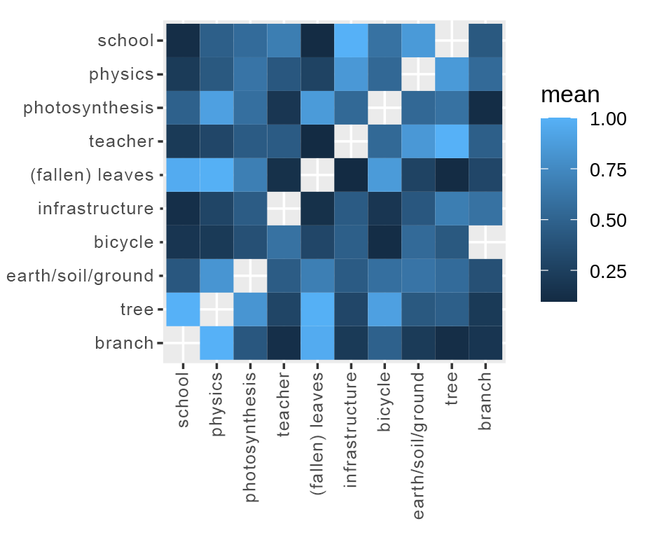
(a) mean values
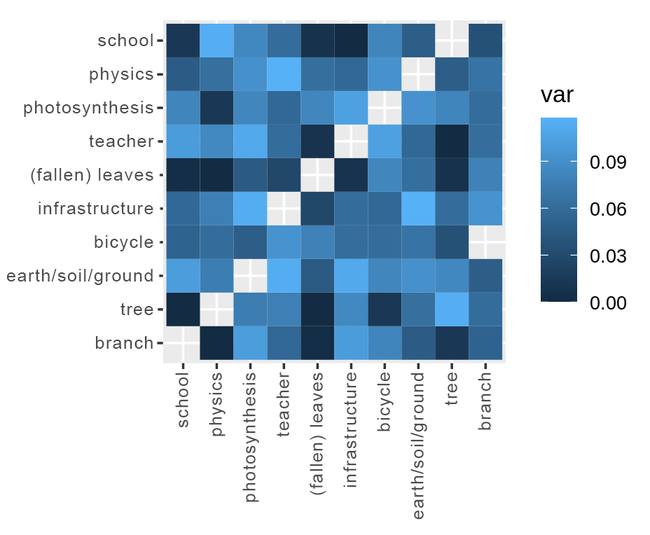
(b) variance values
Figure 5: Mean ratings and their variance derived from pairwise comparison
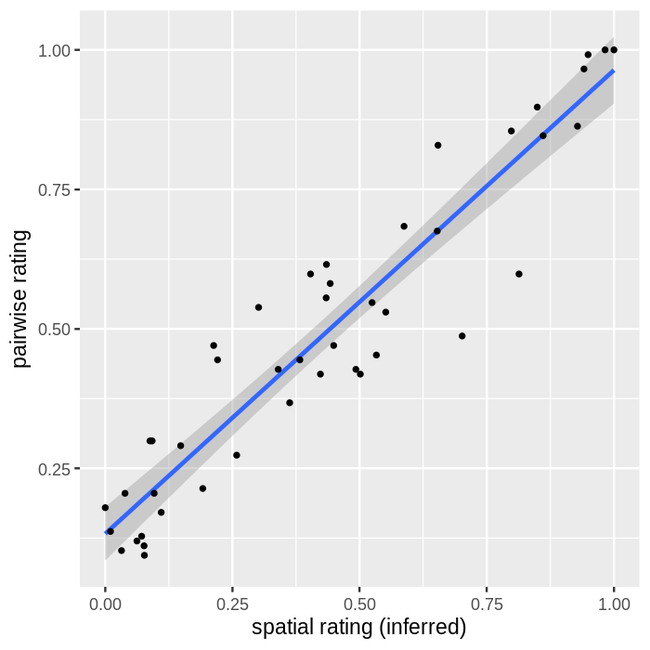
Figure 6: Ratings for all 45 concept pairs, derived from pairwise comparison and inferred from spatial instances
Another exploration of the spatial variant focused on the relationship between the duration of the task and the count of interactive clicks. This association is visually depicted in Figure 7, which also includes a linear model (lm) and its 95% confidence interval. The evidence suggests that the longer the participants are engaged with a spatial task, the more they interact via clicks. To measure this connection, we used Kendall's correlation test, which resulted in a correlation coefficient of $tau = 0.480$ and a $p-value < 0.001$, highly signifying a moderate correlation between the two assessed variables.
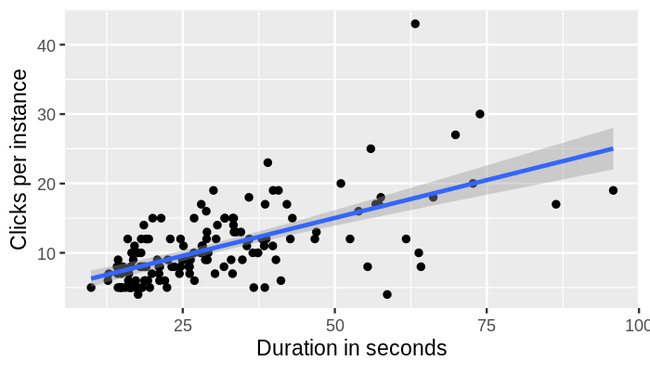
Figure 7: Clicks per spatial instance by duration in seconds
6 Discussion
The study confirmed that the duration of the tasks aligned with the estimates of the preliminary test, indicating successful test execution, aside from a single software bug. Feedback from the participants suggested that the test length was appropriate, with no reports of fatigue, although they found the pairwise comparisons somewhat monotonous. The ratings obtained from both tasks showed similar averages but varied significantly in their distribution: the ratings from spatial sessions ranged from 0.24 to 0.88. This variation may be attributed to the algorithm used in the spatial tasks, which assigns a zero rating to the concept pair furthest apart. However, participants appeared to focus more on creating a coherent structure involving all five concepts rather than strictly assessing distances. Similarly, the highest rating was similarly substantially less than one.
Inter-rater agreement exceeded expectations, indicating consistency even among concept pairs expected to be controversial. The interclass correlation coefficient ($ICC$) and Cohen's weighted $kappa$, which reflect the variability of ratings, suggest that our selection of concepts effectively balanced controversial and consistent pairs, as evidenced by a broad range of variance values. The resulting weighted knowledge graph encompasses ten concepts, with weights based on participants' ratings of each pair's relationship. This graph serves as a robust baseline for comparison with other methodologies, such as those derived from spatial sessions.
The question addressed in this study is whether spatial structures can be interpreted by a system, specifically a spatial parser, based on proximity values, so that the resulting definable knowledge framework reflects the knowledge presented in the human-generated spatial structure. This objective aligns with common techniques for mental model elicitation and representation. However, it remains to be fully determined whether system-generated concepts (i.e., recommendations) placed in an existing spatial structure may augment an individual's mental model, as practically addressing this question was not part of this study. Our approach, employing a simplistic spatial parser, generated a weighted graph, enabling direct comparison with the baseline. However, it is important to note the limitations of the experiment:
The restricted set of five concepts per instance raises questions about scalability and the clarity of more complex structures.
The parser's outputs are averaged across multiple instances and users, rather than being used as direct inputs.
The dynamic nature of knowledge and spatial hypertext suggests that these static snapshots may not fully capture the evolving context of information.
Our analysis aimed to demonstrate a correlation between the ratings obtained from both the baseline (pairwise comparison ratings) and the spatial approach, ideally reflecting each other. Although the mean absolute error (MAE) was higher than expected due to the range of ratings and the influence of controversial pairs, a clear linear correlation was evident, as depicted in Figure 6. Kendall's $tau$ further supported this observation, indicating a strong relationship between the variables. This can be attributed to the significance of proximity in spatial hypertext applications and information visualization in general [6, 35].
By normalizing the diverging minimums and maximums to a consistent range from zero to one, the linear model describing the relationship between the baseline and the spatial ratings exhibited a gradient close to 1 (1.06). Spatial ratings are derived from the relative distances between concepts, assuming a linear correlation between distance and relational weight. Essentially, as users decrease the relational weight between two concepts, they proportionally reduce the physical distance between them, and vice versa.
This discovery is crucial as it contributes to the insight on how to visualize spatial relationships within hypertext systems. The linear relationship between distance and weight holds practical implications, particularly in the spatial composition of concepts through algorithms in a spatial hypertext application [32, 40]. For instance, the weights derived from the pairwise comparisons can be translated into spatial distances ranging from $d_{min}$ to $d_{max}$, based on a linear correlation. To illustrate this concept, we employed Box2D<sup>6</sup> to manage physical constraints and depicted deviations from ideal distances with a color gradient ranging from light green to dark red. For instance, the proximity of Baum (tree) to Photosynthese (photosynthesis) would be closer were it not for the spatial constraints imposed by other elements within the system. This visualization, depicted in Figure 8, underscores the practical significance of our findings in translating implicit relations (i.e., associations based on an individual's mental model/knowledge) into an actionable spatial structure. In our study, knowledge, represented as a simple undirected weight between concepts, effectively predicts the proximity with which individuals arrange these concepts in a 2D space.
<sup>6</sup> A 2D, rigid body physics engine for games: https://box2d.org/
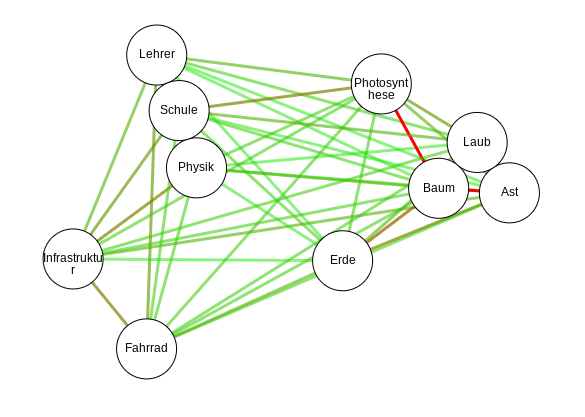
Figure 8: Simulated, force-directed layout of the gathered weight data
Although not initially our focus, our findings suggest a correlation between the number of clicks and time spent in a spatial instance, indicating the iterative nature of spatial hypertext. Interviews support the notion that users iteratively refine their spatial arrangements when they are uncertain about structuring. This 'hands-on' adjustment, as captured in system logs, enables the analysis of evolving structures and facilitates the identification of patterns within these adjustments. Understanding this refinement process could enhance features like spatial parsing, similar to advancements seen in Schedel's temporal parser [35].
7 Conclusion and Future Work
The presented study establishes a positive correlation between weighted relationships derived from pairwise comparisons of concepts and those observed in parsing spatial hypertext instances, each containing five concepts. This validation underscores the practical value of spatial hypertext structures in facilitating knowledge generation, indicating that users often encode their understanding visually through the physical distancing of concepts. This discovery supports the development of algorithms aimed at enhancing spatial hypertext instances with additional functionalities, leveraging the bidirectional relationship between structure and weight.
Future research could extend these findings by increasing the scale of the study, involving more participants, expanding the knowledge graph, and varying the number of concepts in spatial instances. Additionally, there is a need for further exploration into the effective integration of system-based recommendations into existing spatial structures. Moreover, conducting further analysis on how users adjust and refine spatial structures could provide deeper insights into their interaction patterns, potentially leading to enhancements in interface design and functionality within spatial hypertext systems.
References
A. Armougum, A. Gaston-Bellegarde, C. Joie-La Marle, and P. Piolino. 2020. Expertise Reversal Effect: Cost of Generating New Schemas. Computers in Human Behavior 111 (2020), 106406. https://doi.org/10.1016/j.chb.2020.106406
Pamela S. Barr, J. L. Stimpert, and Anne S. Huff. 1992. Cognitive Change, Strategic Action, and Organizational Renewal. Strategic Management Journal 13, S1 (1992), 15–36. https://doi.org/10.1002/smj.4250131004
Denis Besnard, David Greathead, and Gordon Baxter. 2004. When Mental Models Go Wrong: Co-Occurrences in Dynamic, Critical Systems. International Journal of Human-Computer Studies 60, 1 (jan 2004), 117–128. https://doi.org/10.1016/j.ijhcs.2003.09.001
Robert Botsch. 2011. Chapter 12: Significance and Measures of Association. Scopes and Methods of Political Science (2011).
Peter Bußwolder. 2014. The Effect of a Structured Method on Mental Model Accuracy in Complex Decision Making. Procedia CIRP 20 (2014), 115–119. https://doi.org/10.1016/j.procir.2014.05.040 2nd ICRM 2014 International Conference on Ramp-Up Management.
Stuart K. Card, Jock D. Mackinlay, and Ben Shneiderman. 1999. Readings in Information Visualization : Using Vision to Think. Morgan Kaufmann Publishers Inc., San Francisco. 686 pages. https://dl.acm.org/doi/10.5555/300679
Domenic V. Cicchetti. 1994. Guidelines, Criteria, and Rules of Thumb for Evaluating Normed and Standardized Assessment Instruments in Psychology. Psychological Assessment 6, 4 (1994), 284–290. https://doi.org/10.1037/1040-3590.6.4.284
Jacob Cohen. 2013. Statistical Power Analysis for the Behavioral Sciences. Statistical Power Analysis for the Behavioral Sciences (5 2013). https://doi.org/10.4324/9780203771587
Kenneth James Williams Craik. 1943. The Nature of Explanation. Cambridge University Press: Cambridge, UK.
Muhammed Dağlı and Ahmet Feyzi Satıcı. 2023. The Effects of Multiple Representation Method and Prior Knowledge Level on Problem Solving Skills and Cognitive Load. Participatory Educational Research 10, 5 (2023), 119–146. https://doi.org/10.17275/per.23.78.10.5
James K. Doyle and David N. Ford. 1998. Mental Models Concepts for System Dynamics Research. System Dynamics Review 14, 1 (1998), 3–29. https://doi.org/10.1002/(SICI)1099-1727(199821)14:1<3::AID-SDR140>3.0.CO;2-K
Michael Gary, Robert Wood, and Tracey Pillinger. 2012. Enhancing Mental Models, Analogical Transfer, and Performance in Strategic Decision Making. Strategic Management Journal 33 (11 2012), 1229–1246. https://doi.org/10.2307/41679845
John G. Gaspar, Cher Carney, Emily Shull, and William J. Horrey. 2021. Mapping Drivers' Mental Models of Adaptive Cruise Control to Performance. Transportation Research Part F: Traffic Psychology and Behaviour 81 (2021), 622–638. https://doi.org/10.1016/j.trf.2021.07.012
Dedre Gentner and Donald A. Gentner. 1983. Flowing Waters or Teeming Crowds: Mental Models of Electricity. Erlbaum, 99–129.
Logan M Gisick, Kristen L Webster, Joseph R Keebler, Elizabeth H Lazzara, Sarah Fouquet, Keaton Fletcher, Agnes Fagerlund, Victoria Lew, and Raymond Chan. 2018. Measuring Shared Mental Models in Healthcare. Journal of Patient Safety and Risk Management 23, 5 (2018), 207–219. https://doi.org/10.1177/2516043518796442
Eric J. Golin. 1991. Parsing Visual Languages with Picture Layout Grammars. J. Vis. Lang. Comput. 2, 4 (dec 1991), 371–393. https://doi.org/10.1016/S1045-926X(05)80005-9
Sonia M. Goltz. 2017. Enhancing Simulation Learning With Team Mental Model Mapping. Management Teaching Review 2, 3 (2017), 211–224. https://doi.org/10.1177/2379298117706335
Robin S. Grenier and Dana Dudzinska-Przesmitzki. 2015. A Conceptual Model for Eliciting Mental Models Using a Composite Methodology. Human Resource Development Review 14, 2 (2015), 163–184. https://doi.org/10.1177/1534484315575966
Andreas Größler, Frank Maier, and Peter Milling. 2000. Enhancing Learning Capabilities by Providing Transparency in Business Simulators. Simulation & Gaming 31 (06 2000), 257–278. https://doi.org/10.1177/104687810003100209
Hao-Wei Hsieh and Frank M. Shipman. 2000. VITE: A Visual Interface Supporting the Direct Manipulation of Structured Data Using Two-Way Mappings. In Proceedings of the 5th International Conference on Intelligent User Interfaces (New Orleans, Louisiana, USA) (IUI '00). Association for Computing Machinery, New York, NY, USA, 141–148. https://doi.org/10.1145/325737.325810
P.N. Johnson-Laird. 1980. Mental Models in Cognitive Science. Cognitive Science 4, 1 (1980), 71–115. https://doi.org/10.1016/S0364-0213(81)80005-5
Natalie A. Jones, Helen Ross, Timothy Lynam, Pascal Perez, and Anne Leitch. 2011. Mental Models: An Interdisciplinary Synthesis of Theory and Methods. Ecology and Society 16, 1 (2011).
Terry K. Koo and Mae Y. Li. 2016. A Guideline of Selecting and Reporting Intraclass Correlation Coefficients for Reliability Research. Journal of Chiropractic Medicine 15, 2 (6 2016), 155–163. https://doi.org/10.1016/J.JCM.2016.02.012
J. Richard Landis and Gary G. Koch. 1977. The Measurement of Observer Agreement for Categorical Data. Biometrics 33, 1 (1977), 159–174. https://doi.org/10.2307/2529310
Charlotte Malycha and Günter Maier. 2017. Enhancing Creativity on Different Complexity Levels by Eliciting Mental Models. Psychology of Aesthetics, Creativity, and the Arts 11 (04 2017). https://doi.org/10.1037/aca0000080
Catherine C. Marshall, Frank M. Shipman, and James H. Coombs. 1994. VIKI: Spatial Hypertext Supporting Emergent Structure. In Proceedings of the 1994 ACM European Conference on Hypermedia Technology (Edinburgh, Scotland) (ECHT '94). Association for Computing Machinery, New York, NY, USA, 13–23. https://doi.org/10.1145/192757.192759
M.D. Merrill. 2000. Knowledge Objects and Mental Models. In Proceedings International Workshop on Advanced Learning Technologies. IWALT 2000. Advanced Learning Technology: Design and Development Issues. 244–246. https://doi.org/10.1109/IWALT.2000.890621
Donald A. Norman. 1987. Some Observations on Mental Models. Human-Computer Interaction (1987), 241–244. https://doi.org/10.4324/9781315802725
Olav Reinert, Dirk Bucka-Lassen, Claus Aagaard Pedersen, and Peter J. Nürnberg. 1999. CAOS: A Collaborative and Open Spatial Structure Service Component with Incremental Spatial Parsing. In Proceedings of the Tenth ACM Conference on Hypertext and Hypermedia: Returning to Our Diverse Roots: Returning to Our Diverse Roots (Darmstadt, Germany) (HYPERTEXT '99). Association for Computing Machinery, New York, NY, USA, 49–50. https://doi.org/10.1145/294469.294484
Laura Rook. 2013. Mental Models: A Robust Definition. The Learning Organization: An International Journal 20 (01 2013). https://doi.org/10.1108/09696471311288519
Daniel Roßner, Claus Atzenbeck, and Sam Brooker. 2023. SPORE: A Storybreaking Machine. In Proceedings of the 34th ACM Conference on Hypertext and Social Media (Rome, Italy) (HT '23). Association for Computing Machinery, New York, NY, USA, Article 1, 6 pages. https://doi.org/10.1145/3603163.3609075
Daniel Roßner, Claus Atzenbeck, and Tom Gross. 2019. Visualization of the Relevance: Using Physics Simulations for Encoding Context. In HT 2019 - Proceedings of the 30th ACM Conference on Hypertext and Social Media. ACM Press, New York, New York, USA, 67–76. https://doi.org/10.1145/3342220.3343659
Martin Schaffernicht and Stefan N. Groesser. 2011. A Comprehensive Method for Comparing Mental Models of Dynamic Systems. European Journal of Operational Research 210, 1 (2011), 57–67. https://doi.org/10.1016/j.ejor.2010.09.003
Thomas Schedel. 2016. Spatio-Temporal Parsing in Spatial Hypermedia. Ph. D. Dissertation. Aalborg University. https://opus4.kobv.de/opus4-hof/frontdoor/index/index/docId/71
Thomas Schedel and Claus Atzenbeck. 2016. Spatio-Temporal Parsing in Spatial Hypermedia. In Proceedings of the 27th ACM Conference on Hypertext and Social Media. ACM, 149–157. http://dx.doi.org/10.1145/2914586.2914596
Frank M. Shipman, Haowei Hsieh, Preetam Maloor, and J. Michael Moore. 2001. The Visual Knowledge Builder: A Second Generation Spatial Hypertext. In Proceedings of the 12th ACM Conference on Hypertext and Hypermedia (Århus, none, Denmark) (HYPERTEXT '01). Association for Computing Machinery, New York, NY, USA, 113–122. https://doi.org/10.1145/504216.504245
John Sterman. 1989. Modeling Managerial Behavior: Misperceptions of Feedback in a Dynamic Decision Making Experiment. Management Science 35 (03 1989), 321–339. https://doi.org/10.1287/mnsc.35.3.321
David L. Streiner, Geoffrey R. Norman, and John Cairney. 2014. Health Measurement Scales: A Practical Guide to their Development and Use. Oxford University Press. https://doi.org/10.1093/med/9780199685219.001.0001
F.D. VanSchaik and H.G. Sol. 1990. Effectiveness of Decision Support Systems. In Twenty-Third Annual Hawaii International Conference on System Sciences, Vol. 3. 50–58 vol.3. https://doi.org/10.1109/HICSS.1990.205327
Johannes Wirth, Daniel Roßner, René Peinl, and Claus Atzenbeck. 2023. SPORENLP: A Spatial Recommender System for Scientific Literature. In Proceedings of the 19th International Conference on Web Information Systems and Technologies. SCITEPRESS - Science and Technology Publications, 429–436. https://doi.org/10.5220/0012210400003584
Min Zheng, Jessecae Marsh, Jeffrey Nickerson, and Samantha Kleinberg. 2020. How Causal Information Affects Decisions. Cognitive Research: Principles and Implications 5 (12 2020). https://doi.org/10.1186/s41235-020-0206-z
Do you like what you are reading? Subscribe to receive updates.
Unsubscribe anytime