
Engagement Patterns in TikTok: An Analysis of Short Video Ads
Joni Salminen (University of Vaasa, Vaasa, Finland; jonisalm@uwasa.fi) · Risqo Wahid (University of Jyväskylä, Jyväskylä, Finland; risqo.m.wahid@jyu.fi) · Yanwu Yang (Huazhong University of Science and Technology, Wuhan, China; yangyanwu.isec@gmail.com) · Bernard J. Jansen (Qatar Computing Research Institute, Hamad Bin Khalifa University, Doha, Qatar; jjansen@acm.org)
Published in HT '24: 35th ACM Conference on Hypertext and Social Media · DOI: 10.1145/3648188.3677048 · License: CC BY 4.0
Authors: Bernard J. Jansen, Joni Salminen, Yanwu Yang, Risqo Wahid
Keywords: TikTok advertising, short video ads, social media ads, user behavior, user churn
Session: Practitioners
Pages: 323–329
Conference: HT'24
Abstract
Short videos have become one of the dominant formats of social media content. Such short videos are often boosted by advertising to increase their reach and visibility. We investigate user churn (i.e., drop or loss of consumers during the video viewing) of short video ads on TikTok. Data from the TikTok Ads account of an e-commerce company was analyzed using logistic regression to examine how gender, age groups, and video duration affect users' video viewing behaviors. The findings indicate that (1) most customers leave the ads within the first quarter of the video; (2) males and females exhibit similar viewing behaviors, but (3) age groups vary by their viewing behaviors. Somewhat surprisingly, we discovered that (4) there is no significant correlation between user churn and ads performance metrics (i.e., cost-per-mille, cost-per-click, and click-through rate).
Keywords
TikTok advertising, short video ads, user churn, user behavior, social media ads
ACM Reference Format
Joni Salminen, Risqo Wahid, Yanwu Yang, and Bernard J. Jansen. 2024. Engagement Patterns in TikTok: An Analysis of Short Video Ads. In 35th ACM Conference on Hypertext and Social Media (HT '24), September 10–13, 2024, Poznan, Poland. ACM, New York, NY, USA, 7 pages. https://doi.org/10.1145/3648188.3677048
1 INTRODUCTION
Online short videos (typically less than one minute) created for social media platforms [23] have become one of the dominant formats of social media content. Short videos appear under different names on various platforms: e.g., "Shorts" on YouTube, "Reels" on Instagram and Facebook. TikTok is the dominant platform for short video content [21]. Although TikTok primarily relies on user-generated content, it also serves as an advertising platform to connect brands with potential customers [14]. Companies and other content producers can boost their content using short video advertising (SVA) [1]. Due to the popularity of short videos [4, 13], advertisers are increasingly investing in TikTok Ads which is the platform's advertising tool [16]. However, due to their novelty, there is still scarce empirical evidence on how users engage with SVA on major social media platforms, particularly TikTok.
An especially impactful issue is user churn, which is the drop or loss of users during a video's playtime. That is, users are exposed to a video ad on their social media feed; out of these, a certain percentage continues watching (while others dismiss the video by scrolling down), then a certain percentage drops during the video before reaching the end. A high churn indicates low engagement and vice versa [2]. Mitigating audience churn is important, because advertisers desire that their videos are watched in their entirety, so that the key message is conveyed effectively.
While understanding the process of churn is conceptually straightforward, there is little evidence on churn at different stages of the SVA process actually is. Do most users continue until the end of the video ad once they have started watching? Or does only a tiny minority watch till the end? What factors are correlated with these behaviors? These are some of the questions motivating our research, while we focus on the following research questions (RQs):
RQ1: What is the overall churn rate among users in TikTok Ads?
RQ2: Are there demographic differences in the short video viewing behaviors?
RQ3: Is churn rate correlated with industry-standard ad performance metrics?
We address the RQs using logistic regression. RQ3 has a specific focus on how churn is related to performance metrics commonly used in short video advertising, including (a) impression cost (CPM: cost-per-mille, i.e., "The average amount of money you've spent per 1,000 impressions."¹), (b) click cost (CPC: cost-per-click, i.e., "The average amount of money you've spent on a click."²), and (c) click performance (CTR: click-through rate, i.e., "The percentage of times people saw your ad and performed a click."³)?
¹ https://ads.tiktok.com/help/article?aid=10000165
² Ibid.
³ Ibid.
2 RELATED LITERATURE
Literature has investigated video ads on different platforms. Ge et al. [7] studied how user-generated video ads influence sales on Douyin (i.e., a short video-based social media in China). On Hulu, Schweidel and Moe [17] analyzed factors driving binge-watching behavior and how such behavior relates to advertising responses. Joa et al. [13] explored the aspects that likely drive video views of online in-stream video ads, considering factors of viewing device, user experience as a "prosumer" content creator, viewing context, video characteristics, and advertising appeals. Jeon et al. [12] investigated whether the decrease of temporal uncertainty (i.e., the usage of a timer to inform viewers of the ads' length) in skippable ads lessens users' likelihood to skip ads and alleviates viewers' irritation toward ads. Inspired by ads on Netflix and YouTube, Shon et al. [18] collected consumers' preference data through a conjoint survey to identify reasons for blocking ads. Studies show that video ads are context dependent. Comparing video ad performance on laptops and mobile devices, Stewart et al. [19] discovered that consumers are more inclined to seek more information and opt-in for more product information when video ads are displayed on a laptop than when video ads appear on mobile devices. Bellman et al. [4] found that the viewing completion rates of video ads are higher on television than on online networks.
TikTok differs from other platforms in some respects. While other platforms (e.g., Instagram) favor content from accounts with large followers (e.g., influencers), TikTok treats users equally [8]. This means that each user's videos have equal chances to be viewed by other users, and hence even videos from small accounts (i.e., users with small follower counts) have a chance to go viral. TikTok is also rich with built-in editing features [21], and although it is a video-based social media, its central attraction is sounds [20, 22]. With these different attributes, TikTok may offer new insights regarding SVA performance and user behavior.
3 METHODOLOGY
3.1 Description of the Case Organization
The organization is a Finnish e-commerce shop that sells experience gifts, which are gift cards that contain an experiential service (e.g., tandem jump, rally driving, dinner in the dark) from a particular service provider. As a product category, experience gifts reflect the trend of immaterial consumption, as they provide an alternative to purchasing material gifts [5, 6]. The organization has several years of experience with online video advertising campaigns, including Facebook and YouTube Ads. Recently, the organization initiated a new strategy of focusing their video content creation effort on TikTok, due to TikTok's popularity among the organization's core target groups. This is supported by investments in SVA that intend to support the video circulation via ads. As such, the organization is an experienced online video marketing business, reflective of many other online companies, and suitable for this study.
3.2 Data Collection and Analysis
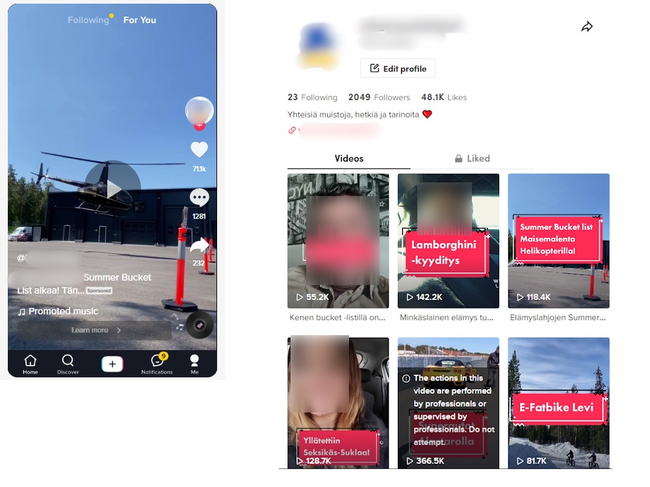
Figure 1: On the left-hand side, there is an example from the focal channel's TikTok short video ad. The right-hand side shows the channel's typical content. Company-identifying information has been blurred.
We collected the data from the e-commerce organization's TikTok Ads account (see Figure 1) by manually downloading a spreadsheet. The data collection was done with the account owner's permission. We obtained ad engagement metrics for diverse users viewing videos that were used as ads on TikTok. The average duration of the videos was 56.7 seconds (SD = 14.5 seconds). On average, each ad video garnered 161,898 impressions (SD = 152,112). The total number of impressions obtained by the ad videos was approximately two million (1,942,785). The data also contains information about the gender and age groups of these users. Genders include Male and Female, as TikTok does not currently provide any other gender identification. The age groups were bucketed by TikTok (13-17, 18-24, 25-34, 35-44, 45-54, and over 54)–social media platforms typically allow exporting aggregated data only.
Conceptually, one can fathom the "user journey" of viewing ads on TikTok as follows (each step preceding the next one): impressions → video views → views at 25% → views at 50% → views at 75% → views at 100%. In other words, "impressions" describes the number of total ad exposures. One can scroll down the feed so quickly that the "video view" event is not initiated (even though results in Section 4 illustrate that this is rarely the case). TikTok records the remaining users at each of these intervals, which can be exported using the advertising platform.
Given this, we created four dummy variables to account for the engagement percentage: "Zero to 25 percent", "25 to 50 percent", "50 to 75 percent", and "75 to 100 percent", each taking the value of one if a user leaves the video after watching less than 25 percent of its duration, after watching more than 25 percent of the video but less than 50 percent, and after watching more than 50 percent of the video but not the entire video, respectively, and zero otherwise.
To address RQ1, we analyze descriptive statistics. To address RQ2, we use logistic regression to examine how gender, age groups, and video duration affect video viewing behavior. Logistic regression, also known as a logit model, is applied to a dichotomous outcome or so-called dependent variables. In our analyses, we use "Did not watch", "Churn at 0-25%", "Churn at 25-50%", "Churn at 50-75%", "Churn at 75-100%", and "Full Video" as outcome variables. In the logit model, the log odds of the outcome are modelled as a linear combination of the predictor variables. For ease of interpretation of the estimated coefficients, however, we calculate the marginal effects. Marginal effects are used to describe how the predicted probability of a binary outcome changes when a risk factor (gender and age group in the framework) is altered. Finally, to address RQ3, we examine how different loss rates are correlated with CPC and CPM, and CTR.
4 FINDINGS
Concerning RQ1, the overwhelming majority–85.2%–of users exit the ad video during the first 25% of the ad video's duration. Overall, 7 percent watch less than half but more than 25 percent; and only 6 percent watch more than half but not the entire video. The analysis indicates three major infliction points (see Figure 2): a major increase in churn during the first 25% of the video duration, after which an almost equally dramatic drop in churn till the 50% mark of the video duration; finally, a trend of increasing churn toward the end of the video duration. While there is some variation in the ads' performance (seen from the diverging lines after the 25% of the video watched event), the steep decline is consistent: all twelve of the tested video ads lost more than 80% of their viewers within the first 25% of the video's duration.

Figure 2: User churn/retention at different stages of watching the short video ad. Retention is calculated always from the previous stage (i.e., the values do not amount to 100%), the formula R=1-C where C is the churn rate. The 'death valley' effect can be seen from the steep decline between the 'Video view' and '25% of the video watched' events.
On average, the churn from impression to video view start was 6.2% (SD = 0.7%), from video view start to 25% of the video having been watched the churn was 85.2% (SD = 4.4%), from 25% to 50% of the video having been watched the churn was 48.1% (SD = 12.2%), from 50% to 75% of the video having been watched the churn was 46.2%, and from 75% to 100% of the video having been watched the churn was 63.9%. So, the churn experiences a strong increase in the beginning, after which the remaining user base roughly halves at each interval, meaning approximately half of the remaining viewers are lost at each stage. Towards the end of the video, the churn picks up as the user tunes out to (presumably) prepare for watching another video that TikTok autoplays in the user's feed.
Concerning RQ2, Table 1 shows the effect of age on different engagement metrics. Compared to all the groups, users aged between 18-24 are more likely to skip the video, and users older than 55 are more likely to leave the video before watching 25% of it, which has the largest coefficient among the different age groups. The age group of 45-55 is more likely to leave the video after watching 25% but before watching 50% of it. Users between 13-17 and 18-24 are more likely to watch more than 50% of the video compared to other age groups, as all the coefficients for age groups are negative and significant except age group of 18-24 (the coefficient is negative but not statistically significant), which suggests that the baseline group, i.e., 13-17, has the highest propensity to leave the video at 50-75 and 75-100. Finally, users aged between 13-17 are more likely to watch the entire video.
Table 1: Marginal effects from the Logit Regression.
| | Did not watch | Churn at 0-25% | Churn at 25-50% | Churn at 50-75% | Churn at 75-100% | Full video |
|---|---|---|---|---|---|---|
| 13-17 | Baseline | Baseline | Baseline | Baseline | Baseline | Baseline |
| 18-24 | -0.0176*** (0.00116) | 0.0425*** (0.00162) | 0.0157*** (0.000962) | -0.0239*** (0.000980) | -0.0318*** (0.000958) | -0.00580*** (0.000592) |
| 25-34 | -0.0361*** (0.00118) | 0.0548*** (0.00166) | 0.0126*** (0.000999) | -0.0275*** (0.000996) | -0.0352*** (0.000969) | -0.00787*** (0.000603) |
| 35-44 | -0.0127*** (0.00191) | 0.0425*** (0.00260) | -0.00420*** (0.00161) | -0.0134*** (0.00156) | -0.0188*** (0.00147) | -0.00706*** (0.000896) |
| 45-54 | -0.0319*** (0.00168) | 0.0578*** (0.00244) | -0.000221 (0.00159) | -0.0237*** (0.00140) | -0.0256*** (0.00135) | -0.00954*** (0.000821) |
| ≥55 | -0.0162*** (0.00156) | 0.0731*** (0.00207) | -0.0111*** (0.00128) | -0.0262*** (0.00121) | -0.0279*** (0.00118) | -0.00937*** (0.000730) |
| Length | -0.0000651*** (0.0000151) | 0.00208*** (0.0000205) | -0.00200*** (0.0000143) | 0.000318*** (0.0000121) | -0.000155*** (0.00000976) | -0.00000931 (0.00000739) |
| Observations | 1942785 | 1942785 | 1942785 | 1942785 | 1942785 | 1942785 |
Notes: Standard errors in parentheses. * p < 0.10, p < 0.05, * p < 0.01
For a sub-set of data, we observe both male and female users, and there we test the effect of gender on the engagement behavior. Results from the ordinary logit regression (see Table 2) indicate no statistical distinction between men and women who do not watch the short video ads videos. Compared to males, females are less likely to leave the short video ad before watching 25% (second column) or 50 % (third column) of it; however, they are more likely than males to watch the entire short video ad (sixth column) or more than half of it (see the fourth and fifth columns).
Table 2: Marginal Effects from the Logit Regression (Considering Gender).
| | Did not watch | Churn at 0-25% | Churn at 25-50% | Churn at 50-75% | Churn at 70-100% | Full video |
|---|---|---|---|---|---|---|
| Female | -0.0000632 (0.000964) | -0.00840*** (0.00128) | -0.00321*** (0.000765) | 0.00597*** (0.000749) | 0.00470*** (0.000729) | 0.000973** (0.000439) |
| 13-17 | Baseline | Baseline | Baseline | Baseline | Baseline | Baseline |
| 18-24 | 0.00769*** (0.00161) | 0.0108*** (0.00210) | -0.00617*** (0.00120) | -0.00199 (0.00124) | -0.000160 (0.00125) | -0.00249*** (0.000758) |
| 25-34 | -0.00336** (0.00154) | 0.0388*** (0.00202) | -0.00466*** (0.00119) | -0.0110*** (0.00118) | -0.0167*** (0.00115) | -0.00626*** (0.000716) |
| 35-44 | -0.0122*** (0.00191) | 0.0338*** (0.00260) | -0.00221 (0.00157) | -0.00946*** (0.00153) | -0.0156*** (0.00146) | -0.00629*** (0.000892) |
| 45-54 | -0.0311*** (0.00171) | 0.0399*** (0.00254) | 0.00358** (0.00159) | -0.0159*** (0.00145) | -0.0195*** (0.00141) | -0.00813*** (0.000844) |
| ≥55 | -0.0155*** (0.00157) | 0.0609*** (0.00208) | -0.00831*** (0.00125) | -0.0206*** (0.00120) | -0.0235*** (0.00117) | -0.00830*** (0.000731) |
| Length | -0.00114*** (0.000285) | 0.0312*** (0.000623) | -0.00717*** (0.000309) | -0.0152*** (0.000553) | -0.0129*** (0.000494) | -0.00200*** (0.000180) |
| Observations | 308936 | 308936 | 308936 | 308936 | 308936 | 308936 |
Notes: Standard errors in parentheses. * p < 0.10, p < 0.05, * p < 0.01
Concerning RQ3, all the loss variables are positively and significantly correlated with one other (see Table 3). However, they are not significantly correlated with CPC and CPM, and only in one case are they significantly correlated with CTR (there is a negative relationship between churn at 25-50% and CTR). CPC and CPM, on the other hand, are negatively correlated with one other. These findings imply that TikTok's pricing algorithm does not appear to consider churn when determining the cost for advertising.
Table 3: Correlation matrix. The colors indicate that churn metrics are significantly correlated with each other (green region) and with performance metrics (orange region) but not with performance metrics (yellow region).
| Variables | (1) Did not watch | (2) Churn at 0-25% | (3) Churn at 25-50% | (4) Churn at 50-75% | (5) Churn at 75-100% | (6) CPC | (7) CPM | (8) CTR |
|---|---|---|---|---|---|---|---|---|
| (1) Did not watch | 1.00 | | | | | | | |
| (2) Churn at 0-25% | 0.987*** | 1.00 | | | | | | |
| (3) Churn at 25-50% | 0.921*** | 0.917*** | 1.00 | | | | | |
| (4) Churn at 50-75% | 0.925*** | 0.932*** | 0.804*** | 1.00 | | | | |
| (5) Churn at 75-100% | 0.931*** | 0.907*** | 0.868*** | 0.824*** | 1.00 | | | |
| (6) CPC | 0.150 | 0.197 | 0.140 | -0.017 | 0.231 | 1.00 | | |
| (7) CPM | -0.184 | -0.212 | -0.213 | -0.151 | -0.135 | -0.334** | 1.00 | |
| (8) CTR | -0.229 | -0.300** | -0.242 | -0.108 | -0.186 | -0.827*** | 0.544*** | 1.00 |
Notes: * p<0.01, p<0.05, * p<0.1
5 DISCUSSION
5.1 Interpreting the Findings
We investigated user behavior and engagement with TikTok short video ads. The findings show that most users leave the ads within the first quarter of the video, with age groups showing varying behaviors. The user churn exhibits a drastic increase at the beginning of the ad exposure, typically losing more than 80% of the viewers in the first 25% of the ad's duration, which we refer to as the 'death valley' effect of short video ads. Therefore, short video ads in TikTok should seize consumers' attention within the first couple of seconds, as churn is most drastic at the beginning of video ad content. After the death valley, the ad loses about half of the remaining users at each interval. This behavior remains steady until approaching the end of the video, where the churn again increases as the users ready themselves for the following video that TikTok shows in their feed. Overall, the attention span among users exposed to short video ads appears to be extremely short. Males and females exhibit similar viewing behavior, whereas age groups reveal varying viewing behavior, which is consistent with the notion that generations exhibit distinct online user behaviors [9].
Given the meager switching cost among in social media feeds (i.e., users can just scroll down with minimal effort) and the hypercompetitive nature of social media newsfeeds [10], catching the users' attention seems to be imperative for achieving any feasible elaboration likelihood. Specifically, the overall trend within SVA is that, once video viewing has begun, churn increases drastically. We can conceptualize this as the 'assessment period' during which the user decides whether or not to continue watching. Once the major decision is made, the churn rate drastically decreases, i.e., the user continues watching the video. The low initial churn implies that TikTok is efficient at automatically playing the ads, i.e., the churn from impressions to video views is relatively the lowest. At this stage, users do not have a choice of churning because the ad is auto-playing. This implies that the "Video view" is a so-called vanity metric, as the video view is not initiated by the user but by the system.
Connecting situational factors with online social media user behavior and frameworks like the elaboration likelihood model [15] is one direction for future work. Another line deals with "non-distraction attitudes towards TikTok advertising" by Arrosyid [3]–under which conditions can users be enticed to 'give content a chance' prior to browsing on? Specifically, are there situational factors and can advertisers (or the platform) affect the attentional outcomes of users with anything other than the video content? We leave these questions for future work on SVA.
5.2 Practical Implications
TikTok is a powerful marketing tool that helps advertisers reach millions of consumers with relatively affordable CPM prices. Theoretically, it is easy to gain millions of "views" on TikTok, but it is questionable whether these views have any economic value for the business, as only a small fraction of the users exposed to the ads actually view them till the end. Interestingly, ad performance metrics are not correlated with user churn, implying that TikTok's pricing algorithm does not consider loss when determining the cost of advertising. Moreover, "Video views" appears to be a vanity metric, as the actual 100% completion rate is around 1% of the video views reported in TikTok's default user interface.
There were statistically significant differences among age groups in SVA engagement, implying that age is a worthwhile factor for ad targeting as different age groups react to ads differently.
An important implication concerning the performance figures is that the high churn rate tends to inflate the perception of how well TikTok Ads performs. This is because the standard CPV (cost per view) that advertisers use to assess the cost of "engagement" they obtain for their ads is calculated using the "View" metric as a basis. However, as we have argued here, this metric over-exaggerates the actual performance. Instead, we suggest using a metric we call eCPV or 'effective cost per view', which adjusts any cost-related metrics by the "views at 100%" metric (see Figure 3).

Figure 3: The difference in marketing performance when using the eCPV vs. the standard CPV metric using our dataset. As can be seen, the eCPV yields a significantly higher cost factor to TikTok visibility, t(43) = -8.58, p < 0.0001. We believe that this metric more accurately portrays the value and performance of TikTok campaigning.
For example, consider a hypothetical scenario where a video ad was initiated 1,000,000 times – this number appears a big one! However, if out of those 1M initiations, only 5% would result in complete video viewing, the effective number of viewers would be only 50,000; a much less impressive figure. Thus, advertisers relying on the "Views" metric and failing to verify the churn rate are likely to over-report and exaggerate their performance on TikTok Ads. This condition is similar to 'illusion of data validity' reported in academic literature [11].
Even though impression can be seen as an example of a vanity metric (which is emphasized by the fact that the leap from the ad being shown to the users to the users actually viewing the ad imposes a gigantic loss of the userbase), TikTok uses a variant of impressions on the ad reporting UI. There is currently no option to change this metric to another, such as full video completions. According to our results, it is roughly one out of a hundred users that actually view the video ad completely – this number is obtained by dividing the "views at 100%" metric by the "views" metric (which, again, is essentially a variant of the impression metric containing little to no information on the user behavior). Therefore, if one considers engagement as a more genuine metric for marketing performance than exposure, relying on video views is misleading and results in a fallible position of marketing vanity.
6 CONCLUSION
Catching users' attention is a major challenge in TikTok advertising. In this study, we examined how different engagement metrics change depending on gender and age group of different users. Our results indicate that most users exit the video before watching 25% of it. We did not find statistically different engagement behavior across different genders, but the churning behavior significantly varies among different age groups.
References
Prince Clement Addo, Samuel Kofi Akpatsa, Philip Nukpe, Asare Andy Ohemeng, and Nora Bakabbey Kulbo. 2022. Digital analytics approach to understanding short video advertising in digital marketing. Journal of Marketing Theory and Practice 30, 3 (July 2022), 405–420. https://doi.org/10.1080/10696679.2022.2056487
Kholoud Khalil Aldous, Jisun An, and Bernard J. Jansen. 2019. View, Like, Comment, Post: Analyzing User Engagement by Topic at 4 Levels across 5 Social Media Platforms for 53 News Organizations. In Proceedings of the International AAAI Conference on Web and Social Media, July 06, 2019. 47–57. Retrieved February 3, 2021 from https://ojs.aaai.org/index.php/ICWSM/article/view/3208
Sulkhan Arrosyid. 2022. ANALISIS FAKTOR YANG MEMENGARUHI NIAT BELI PRODUK DI SHOPEE SEBAGAI DAMPAK IKLAN SHOPEE DI TIKTOK. Universitas Gadjah Mada. Retrieved July 18, 2022 from http://etd.repository.ugm.ac.id/penelitian/detail/209025
Steven Bellman, Virginia Beal, Brooke Wooley, and Duane Varan. 2020. Viewing time as a cross-media metric: Comparing viewing time for video advertising on television and online. Journal of Business Research 120, August (2020), 103–113. https://doi.org/10.1016/j.jbusres.2020.07.034
Jackie Clarke. 2008. Experiences as gifts: from process to model. European Journal of Marketing 42, 3/4 (April 2008), 365–389. https://doi.org/10.1108/03090560810852986
Jackie R. Clarke. 2006. Different to 'dust collectors'? The giving and receiving of experience gifts. Journal of Consumer Behaviour 5, 6 (November 2006), 533–549. https://doi.org/10.1002/cb.201
Jiaoju Ge, Yuepeng Sui, Xiaofeng Zhou, and Guoxin Li. 2021. Effect of short video ads on sales through social media: the role of advertisement content generators. International Journal of Advertising 40, 6 (2021), 870–896. https://doi.org/10.1080/02650487.2020.1848986
Michael Haenlein, Ertan Anadol, Tyler Farnsworth, Harry Hugo, Jess Hunichen, and Diana Welte. 2020. Navigating the New Era of Influencer Marketing: How to be Successful on Instagram, TikTok, & Co. California Management Review 63, 1 (2020), 5–25. https://doi.org/10.1177/0008125620958166
Amelia Hassoun, Ian Beacock, Sunny Consolvo, Beth Goldberg, Patrick Gage Kelley, and Daniel M. Russell. 2023. Practicing Information Sensibility: How Gen Z Engages with Online Information. In Proceedings of the 2023 CHI Conference on Human Factors in Computing Systems, 2023. 1–17.
Chih-Cheng Huang. 2016. Inquiring the niche determinants of social media websites in dynamically mobile hypercompetitive communication era. Advances in Mechanical Engineering 8, 3 (2016), 1687814016637330.
Bernard J. Jansen, Joni Salminen, Soon-gyo Jung, and Hind Almerekhi. 2022. The illusion of data validity: Why numbers about people are likely wrong. Data and Information Management (September 2022), 100020. https://doi.org/10.1016/j.dim.2022.100020
Yongwoog Andrew Jeon, Hyunsang Son, Arnold D. Chung, and Minette E. Drumwright. 2019. Temporal Certainty and Skippable In-Stream Commercials: Effects of Ad Length, Timer, and Skip-ad Button on Irritation and Skipping Behavior. Journal of Interactive Marketing 47, (2019), 144–158. https://doi.org/10.1016/j.intmar.2019.02.005
Claire Youngnyo Joa, Kisun Kim, and Louisa Ha. 2018. What Makes People Watch Online In-Stream Video Advertisements? Journal of Interactive Advertising 18, 1 (2018), 1–14. https://doi.org/10.1080/15252019.2018.1437853
Ruiyao Ma and Sojung Kim. 2021. Use, Motivations, and Responses of TikTok as an Advertising Channel. The Journal of the Korea Contents Association 21, 2 (2021), 507–519.
Richard E. Petty and Pablo Briñol. 2011. The elaboration likelihood model. Handbook of theories of social psychology 1, (2011), 224–245.
Markus Rach. 2021. The impact of TikTok's plastic surgery content on adolescents' self-perception and purchase intention. University of South Florida M3 Center Publishing 5, 2021 (2021), 42.
David A. Schweidel and Wendy W. Moe. 2016. Binge watching and advertising. Journal of Marketing 80, 5 (2016), 1–19. https://doi.org/10.1509/jm.15.0258
Minjung Shon, Jungwoo Shin, Junseok Hwang, and Daeho Lee. 2021. Free contents vs. inconvenience costs: Two faces of online video advertising. Telematics and Informatics 56, (2021), 101476.
Kristin Stewart, Matt Kammer-Kerwick, Allison Auchter, Hyeseung Elizabeth Koh, Mary Elizabeth Dunn, and Isabella Cunningham. 2019. Examining digital video advertising (DVA) effectiveness: The role of product category, product involvement, and device. European Journal of Marketing 53, 11 (2019), 2451–2479. https://doi.org/10.1108/EJM-11-2016-0619
Risqo Wahid, Heikki Karjaluoto, and Kimmo Taiminen. 2022. How to Engage Customers on TikTok? In ICIS 2022: Digitalization for the Next Generation, 2022. https://aisel.aisnet.org/icis2022/social/social/11/?utm_source=aisel.aisnet.org%2Ficis2022%2Fsocial%2Fsocial%2F11&utm_medium=PDF&utm_campaign=PDFCoverPages, Copenhagen, 1–17.
Risqo Wahid, Heikki Karjaluoto, Kimmo Taiminen, and Diah Isnaini Asiati. 2023. Becoming TikTok Famous: Strategies for Global Brands to Engage Consumers in an Emerging Market. Journal of International Marketing 31, 1 (September 2023), 106–123. https://doi.org/10.1177/1069031X221129554
Risqo Wahid, Heikki Karjaluoto, Dandison Ukpabi, and Kimmo Taiminen. 2023. Can TikTok Sound Enhance Tourism SMEs' Engagement? In Information and Communication Technologies in Tourism 2023, 2023. Springer, Johannesburg, 142–147. https://doi.org/10.1007/978-3-031-25752-0_15
Yonggui Wang, Aoran Hong, Xia Li, and Jia Gao. 2020. Marketing innovations during a global crisis: A study of China firms' response to COVID-19. Journal of business research 116, (2020), 214–220.
Do you like what you are reading? Subscribe to receive updates.
Unsubscribe anytime